 Published on Aug 15, 2025 by Arcadia Science
 Mapping the spectrum of archaeal protein sequence–structure relationships
Contributors (A-Z)
Mapping the spectrum of archaeal protein sequence–structure relationships
Purpose
We recently compiled an extensive database of Asgard archaea proteomes [1]. Asgard archaea are a recently described and extremely diverse kingdom representing 2 billion years of evolutionary diversity. Novel protein sequences, structures, and functions likely exist among this taxon.
To begin exploring this, we computationally characterized the archaeal sequence–structure relationships landscape. This diverse landscape contains a continuum of relationships; most protein families show a weak-to-moderate correlation between sequence and structure diversity. While the classical framework [2] predicts a tight coupling between sequence and structural divergence, our findings reinforce that this is only one of many possible patterns. Embracing the continuum of archaeal sequence–structure relationships should facilitate more nuanced approaches to protein modelling and engineering.
- All associated code and some data are available in this GitHub repository.
- Larger data files, including all-vs-all TM-align comparisons and per-column Shannon entropy values, are on Zenodo.
Share your thoughts!
Feel free to provide feedback by commenting in the box at the bottom of this page or by posting about this work on social media. Please make all feedback public so other readers can benefit from the discussion.
We’ve put this effort on ice! 🧊
#StrategicMisalignment
Though we determined that a subset of families might have valuable information on sequence–structure relationships, we’ve decided it’s currently out of scope for us to pursue it.
Learn more about the Icebox and the different reasons we ice projects.
Background and goals
Asgard archaea represent one of biology's most evolutionarily significant yet underexplored lineages. As the closest relatives of eukaryotes [3][4][5], their proteomes share much of the complex cellular machinery found among eukaryotes, but have evolved in parallel for approximately 2 billion years. Despite their relationship with eukaryotes, Asgard archaea were first described in 2015. Accordingly, characterizations of archaeal proteome diversity are still nascent. The phylogenetic breadth and long evolutionary history of Asgard archaea make them an untapped resource for identifying novel aspects of protein structure and function.
We aimed to begin mapping the sequence–structure landscape across Asgard protein families, documenting the patterns that emerge from this underexplored evolutionary context. We wanted to understand how protein families within this lineage have navigated the fundamental challenges of protein evolution: maintaining essential structural features while allowing sequence adaptation across vast evolutionary distances.
The patterns we discovered highlight the remarkable richness of evolutionary strategies within Asgard proteomes, but they also complicate simplistic models of protein diversification. Rather than finding uniform relationships between sequence and structural change, we observed a continuum. Some protein families exhibit near-perfect structural conservation despite significant sequence divergence, while in others, sequence and structure have diversified together. These findings challenge entrenched assumptions about how protein structure evolves, and show that protein diversification models must account for fundamentally different evolutionary strategies rather than assuming universal patterns.
The approach
We analyzed a previously compiled dataset of Asgard archaeal and giant virus protein families [1]. The dataset contains > 730,000 Asgard archaea proteins, which we organized into families using Orthofinder (v3.0; RRID: SCR_017118) [6]. We filtered the dataset to include families with ≥ 20 proteins associated with entries in the AlphaFold database (AFDB). After filtering, 4,064 orthogroups comprising 678,072 unique proteins remained.
Multiple sequence alignment and phylogenetic inference
Each orthogroup’s sequences were aligned using MAFFT (run_initial_mafft_parallel.py) (v7.526; RRID: SCR_011811) [7] and filtered to retain only sequences at least 70% the median length (filter_mafft_alignments_by_length.py). Alignments were re-aligned and trimmed using the —gappyout option from TrimAl (refine_alignments.py). We used a highly parallelized version of FastTree 2 [8] called VeryFastTree (v4.0.5; RRID: SCR_023594) [9] to infer approximate maximum-likelihood phylogenies for each orthogroup (run_fasttree_parallel.py).
Sequence diversity analysis
We used a custom script (calculate_sequence_diversity.py) to calculate the average pairwise sequence identity (APSI), per-column Shannon entropy, and normalized Hill diversity (using phylogenetic trees) for each orthogroup. This script generated all of the intra-orthogroup sequence diversity metrics for subsequent analyses.
Structural diversity calculation
To calculate structural diversity, we collected any high-quality (pLDDT > 70) AFDB structures for each orthogroup and used TM-align to do all-vs-all structural alignments (calculate_all_vs_all_metrics.py). We used the mean Chain2 TM-score for each orthogroup and its standard deviation for analysis.
Sequence–structure analysis
We conducted all subsequent analyses and figure generation in the Jupyter Notebook “sequence_structure_notebook.ipynb.” We defined “Structurally Rigid” and “Structurally Plastic” families as having mean TM-scores in the top or bottom quantile among all families, respectively.
To categorize protein families by their sequence–structure relationships, we classified orthologous groups into profiles based on their structural diversity metrics, as follows:
# --- 1. Define Thresholds using Quantiles (25th and 75th percentiles) ---
mean_tm_low_thresh = df_master['Mean_TMscore'].quantile(0.25)
mean_tm_high_thresh = df_master['Mean_TMscore'].quantile(0.75)
stddev_tm_low_thresh = df_master['StdDev_TMscore'].quantile(0.25)
stddev_tm_high_thresh = df_master['StdDev_TMscore'].quantile(0.75)
# --- 2. Create Binned Level Columns ---
conditions_mean = [df_master['Mean_TMscore'] < mean_tm_low_thresh, df_master['Mean_TMscore'] >= mean_tm_high_thresh]
choices_mean = ["Low_Mean_TM", "High_Mean_TM"]
df_master['Mean_TM_Level'] = np.select(conditions_mean, choices_mean, default='Medium_Mean_TM')
conditions_std = [df_master['StdDev_TMscore'] < stddev_tm_low_thresh, df_master['StdDev_TMscore'] >= stddev_tm_high_thresh]
choices_std = ["Low_StdDev_TM", "High_StdDev_TM"]
df_master['StdDev_TM_Level'] = np.select(conditions_std, choices_std, default='Medium_StdDev_TM')
# --- 3. Create Descriptive Structural Profile ---
def assign_structural_profile(row):
if row['Mean_TM_Level'] == 'High_Mean_TM' and row['StdDev_TM_Level'] == 'Low_StdDev_TM':
return 'Structurally Rigid'
elif row['StdDev_TM_Level'] == 'High_StdDev_TM':
return 'Structurally Plastic'
We integrated functional annotations using InterPro domain architectures and calculated intrinsic disorder predictions to understand what sequence features correlate with different structural profiles. Finally, we performed per-column conservation analysis across multiple sequence alignments to identify patterns of sequence conservation within structurally rigid versus plastic families.
Statistical analysis
To determine if the distributions of mean per-column Shannon entropy, APSI, mean intrinsic disorder, and mean domain complexity differed between structural profiles, we applied the two-sample Kolmogorov–Smirnov test. We calculated Cohen's d to quantify the effect size of any observed differences. For non-parametric comparisons of median TM-scores, we used a Mann–Whitney U test and a one-sample t-test to measure whether the median TM-scores of orthogroups were significantly deviated from a null expectation. We then calculated Cohen's d to quantify the effect size of any observed differences.
Visualization
We used arcadia-pycolor (v0.6.3) [10] to generate figures before manual adjustment.
AI tool usage
We used Claude to suggest wording ideas and then choose which small phrases or sentence structure ideas to use. We also used Gemini (2.5 Pro) to help write code, clean up code, and to provide iterative feedback on our research plan as we were considering how to approach this project. For example, running the all-vs-all structural diversity comparison was too heavy for a local machine. Gemini 2.5 Pro proposed specifications and parameters for running it on an AWS EC2 instance, which we implemented. It was also Gemini 2.5 Pro’s idea to represent distributions as kernel density estimates. We used Google Jules to assist with code review and repo organization. We also used Claude to review our code and selectively incorporated its feedback.
The results
Access all related code and some data in this GitHub repository (DOI: 10.5281/zenodo.16883699).
Access larger data files, including all-vs-all TM-align comparisons and per-column Shannon entropy values, on Zenodo (DOI: 10.5281/zenodo.16712749).
The archaeal sequence–structural landscape contains distinctly rigid and plastic protein families
We previously classified ~730,000 Asgard archaea proteins into families (protein families descended from a common ancestor with similar functions, called “protein families” from here on) [1]. In that work, we observed that protein family sequence diversity existed on a continuum and displayed a variety of relationships between phylogenetic diversity, sequence variation, and amino acid features [1]. We wanted to build on that work by incorporating protein structural predictions to resolve the sequence–structure landscape further. We identified 678,072 unique proteins with structural predictions. These proteins were associated with 4,064 protein families. We first wondered if we could locate exceptionally “rigid” (structurally conserved) or “plastic” (structurally variable) populations of protein families. We hypothesized that this stratification would enhance our ability to identify outliers in subsequent analyses, allowing us to identify features or motifs linked to unexpected structural conservation or plasticity.
We classified 454 protein families as structurally rigid (the upper quartile of median TM-score and the lowest quartile of TM-score standard deviation) and 652 as structurally plastic (the highest quartile of TM-score standard deviation). To determine whether the structural profiles of these groups were statistically distinct from the dataset overall, we calculated density distributions of the median pairwise TM-scores of the rigid and plastic families, in addition to the complete dataset (Figure 1, A). TM-scores of the rigid families differed significantly from the overall distribution (rigid median TM-score = 0.94, dataset median TM-score = 0.81; p = 5.2e−171; Mann–Whitney U test) as did the plastic families (plastic median TM-score = 0.71; p = 4.9e−29; Mann–Whitney U test), indicating that these populations are statistically separable from the general continuum.
Does sequence diversity mirror these patterns of structural variation? To address this, we calculated the average pairwise sequence identity (APSI) for all families (37%) as well as the plastic (35%) and rigid families (47%) (Figure 1, B). Again, rigid and plastic families significantly differed from the entire dataset (p = 1.04e−70 and p = 3.4e−56; Kolmogorov-Smirnov test), suggesting that sequence variation also separates these populations.
This raised the question of whether structurally rigid families are simply a function of greater overall sequence conservation, rather than any notable protein features. To test this, we calculated the average median TM-score of families within APSI buckets (e.g., 35–40%, 45–50%). We compared those to the median TM-score of the structurally rigid and structurally plastic families (Figure 1, C). The structurally rigid families and structurally plastic families had median TM-scores that deviated significantly from expectation (p = 6.67e−183 and 2.75e−41; one-sample t-tests), but the effect size (Cohen’s d) for the structurally rigid families was about four times greater (2.296 vs. −0.566). These results support the hypothesis that there are distinct, identifiable, outlier protein families concerning their structural properties. In this case, the structurally rigid families exhibit disproportionately high conservation given their sequence divergence. Conversely, structurally plastic families are significantly less conserved than expected. This demonstrates that these two categories represent statistically identifiable populations that may provide insight into novel patterns of sequence–structure diversification.
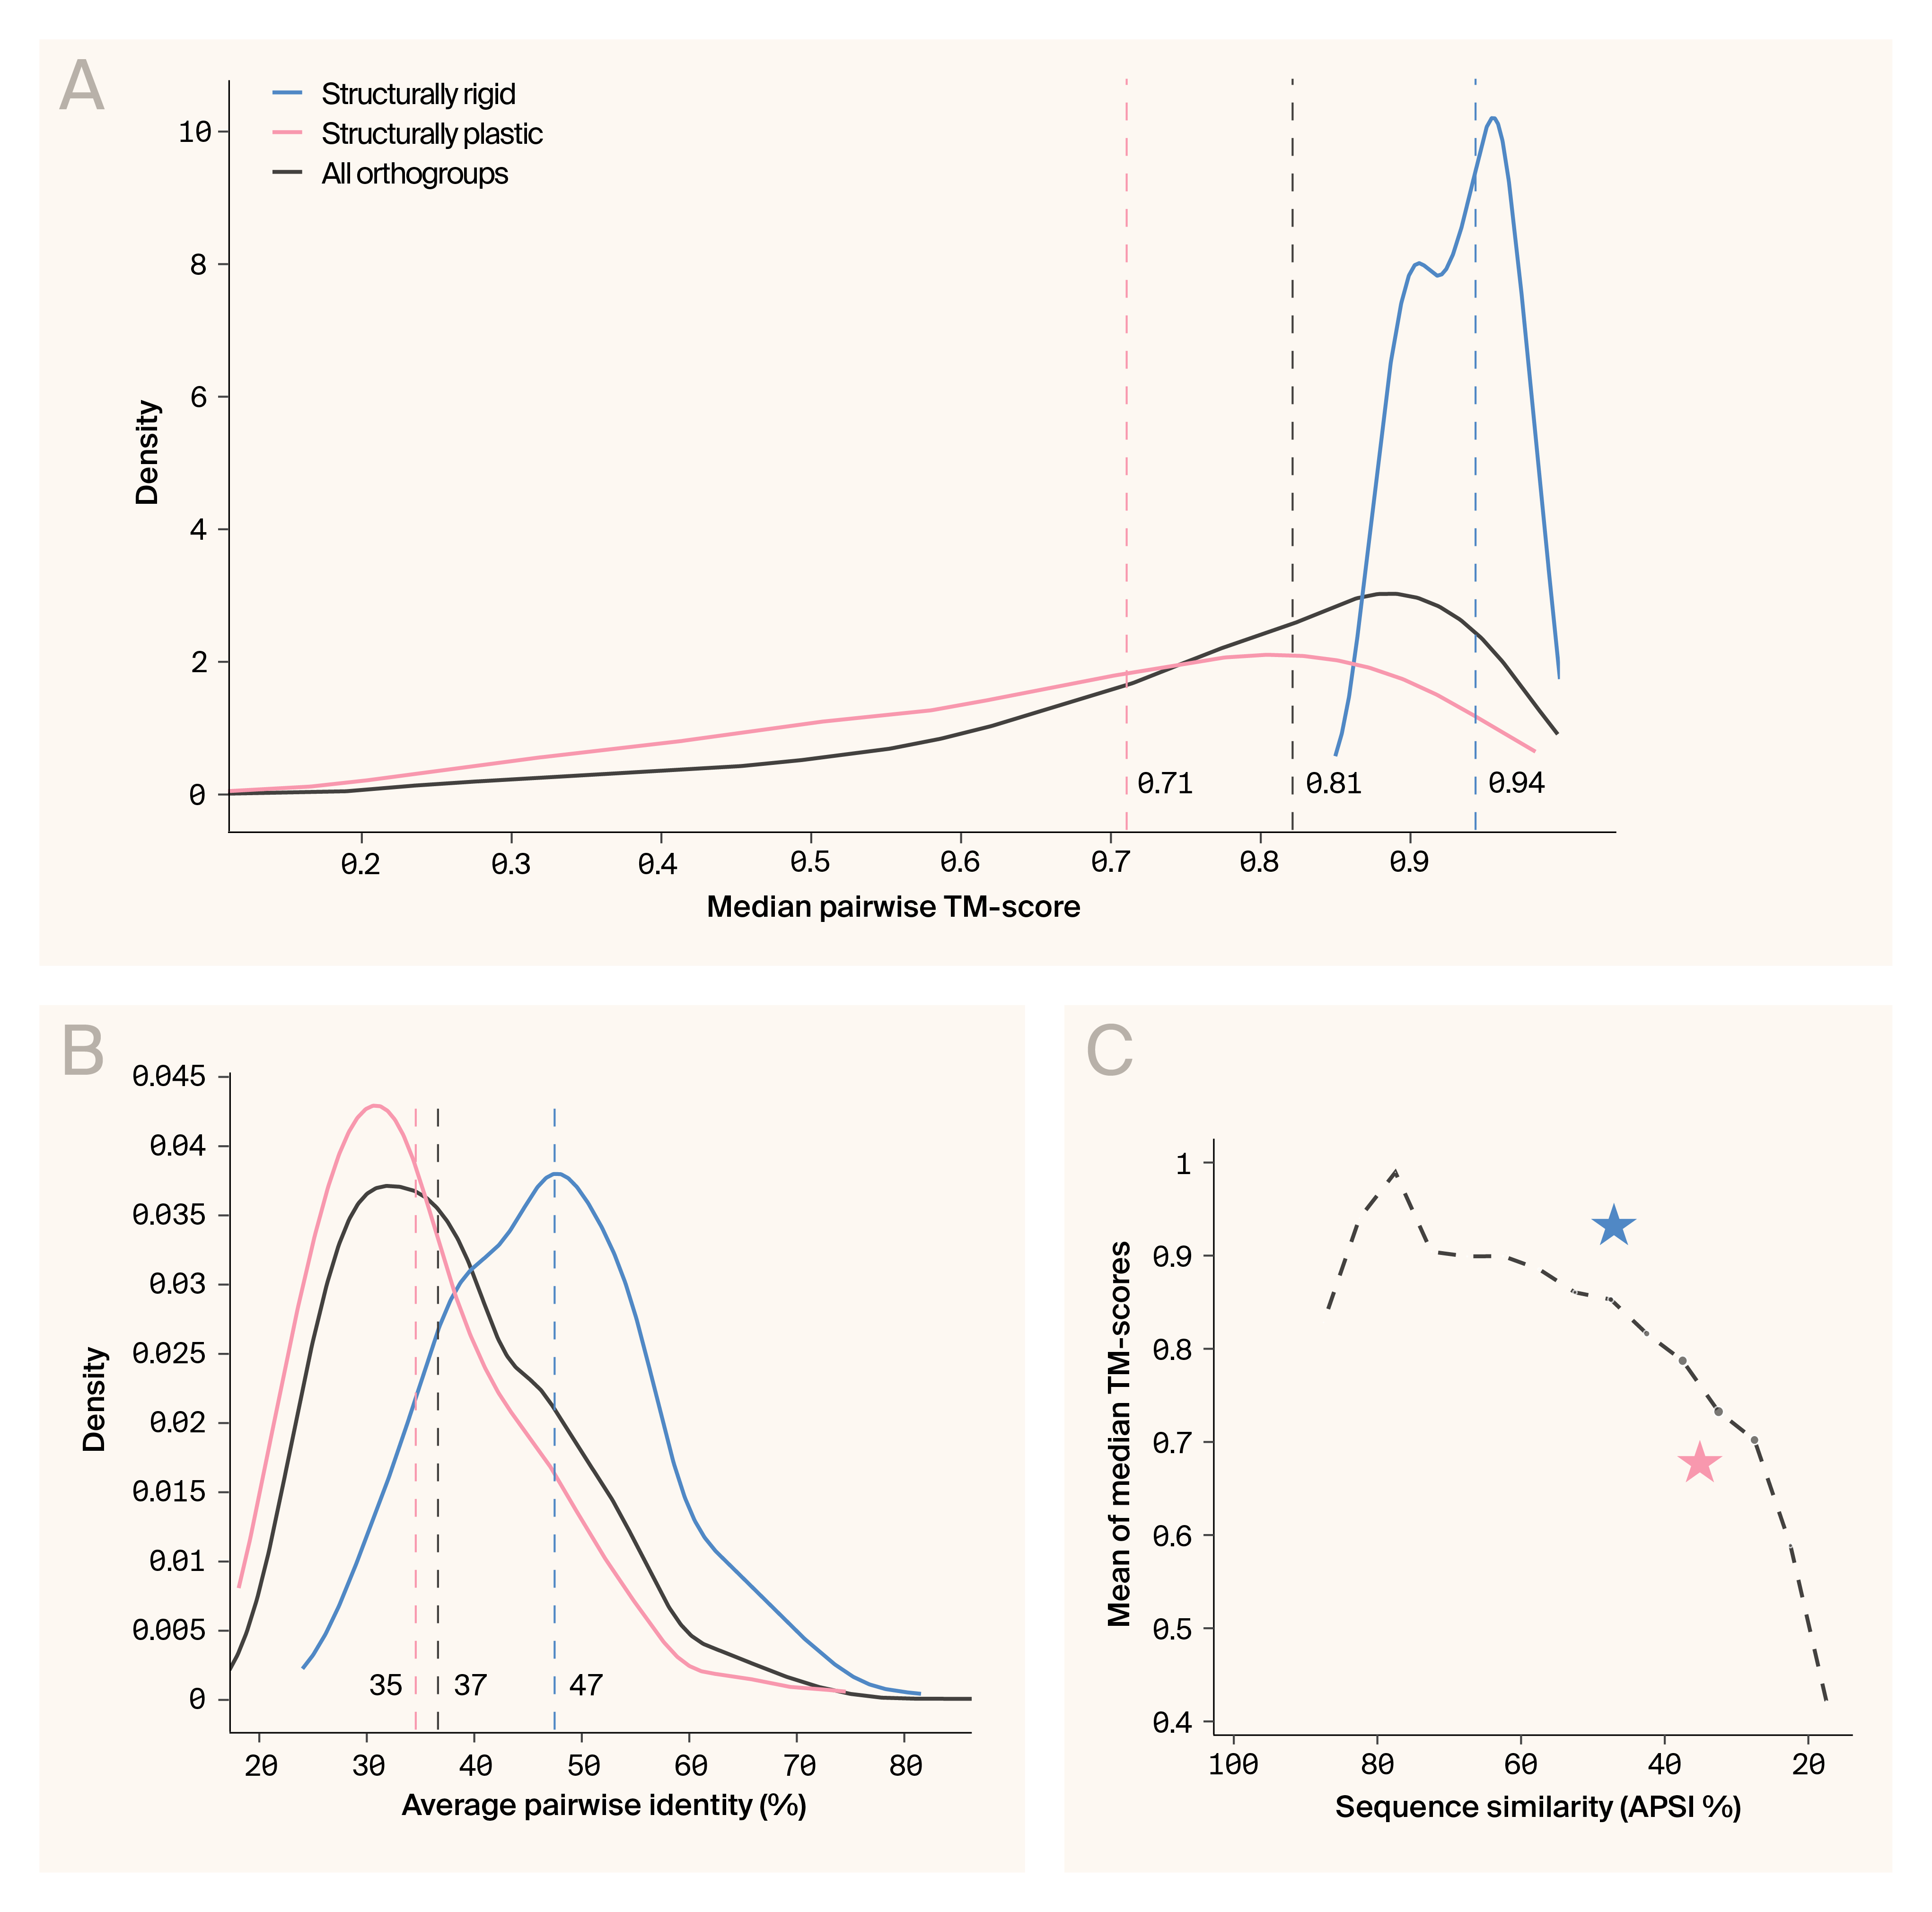
Structurally rigid families exhibit higher than expected structural conservation.
(A) Kernel density plots of median TM-scores reveal that structurally rigid families have near-maximal structural conservation (median TM-score = 0.94) and a narrow distribution.
(B) Density distributions of APSI values reveal that while rigid families generally have higher sequence identity, there's substantial overlap between categories.
(C) Curve of the average median TM-score at a given APSI across the dataset. Blue and red stars indicated the structurally rigid and plastic families, respectively.
Structurally rigid protein families are phylogenetically diverse
Does the evolutionary history of protein families predict structural rigidity? For example, recently evolved families may be more rigid than older ones with more time to diversify. To explore this, we estimated the evolutionary diversity of each protein family using a normalized version of Hill’s diversity. There was no correlation between Hill’s diversity and structural diversity (Figure 2, A), and the density distribution of the structurally rigid families, though shifted slightly to the right, wasn't significantly different relative to either all families or the structurally plastic ones (Figure 2, B). This result points to an intriguing feature of the structurally rigid families, in that their broad representation across the Asgard phylogeny suggests they're old protein families with tightly conserved folds and, presumably, critical functions. We also analyzed the mean-per-column Shannon entropy, a metric describing the amino acid variability at every ungapped position in the alignments. This metric was weakly correlated with structural diversity (Pearson's r = 0.28) (Figure 2, C), but its density distribution shows the structurally rigid families as outliers (p = 3e−67, Cohen’s d = −1.17; Kolmogorov-Smirnov test) (Figure 2, D). The structurally plastic families also differed significantly from the dataset overall (p = 1e−8). Still, the effect size was relatively small (Cohen’s d = 0.25), suggesting these families are less of an outlier than the structurally rigid ones.
These patterns reveal that structural rigidity isn't simply a consequence of recent evolutionary origin or limited phylogenetic sampling. The structurally rigid protein families are ancient and broadly distributed across Asgard archaea and have maintained their folds for 2 billion years, despite extensive sequence divergence.
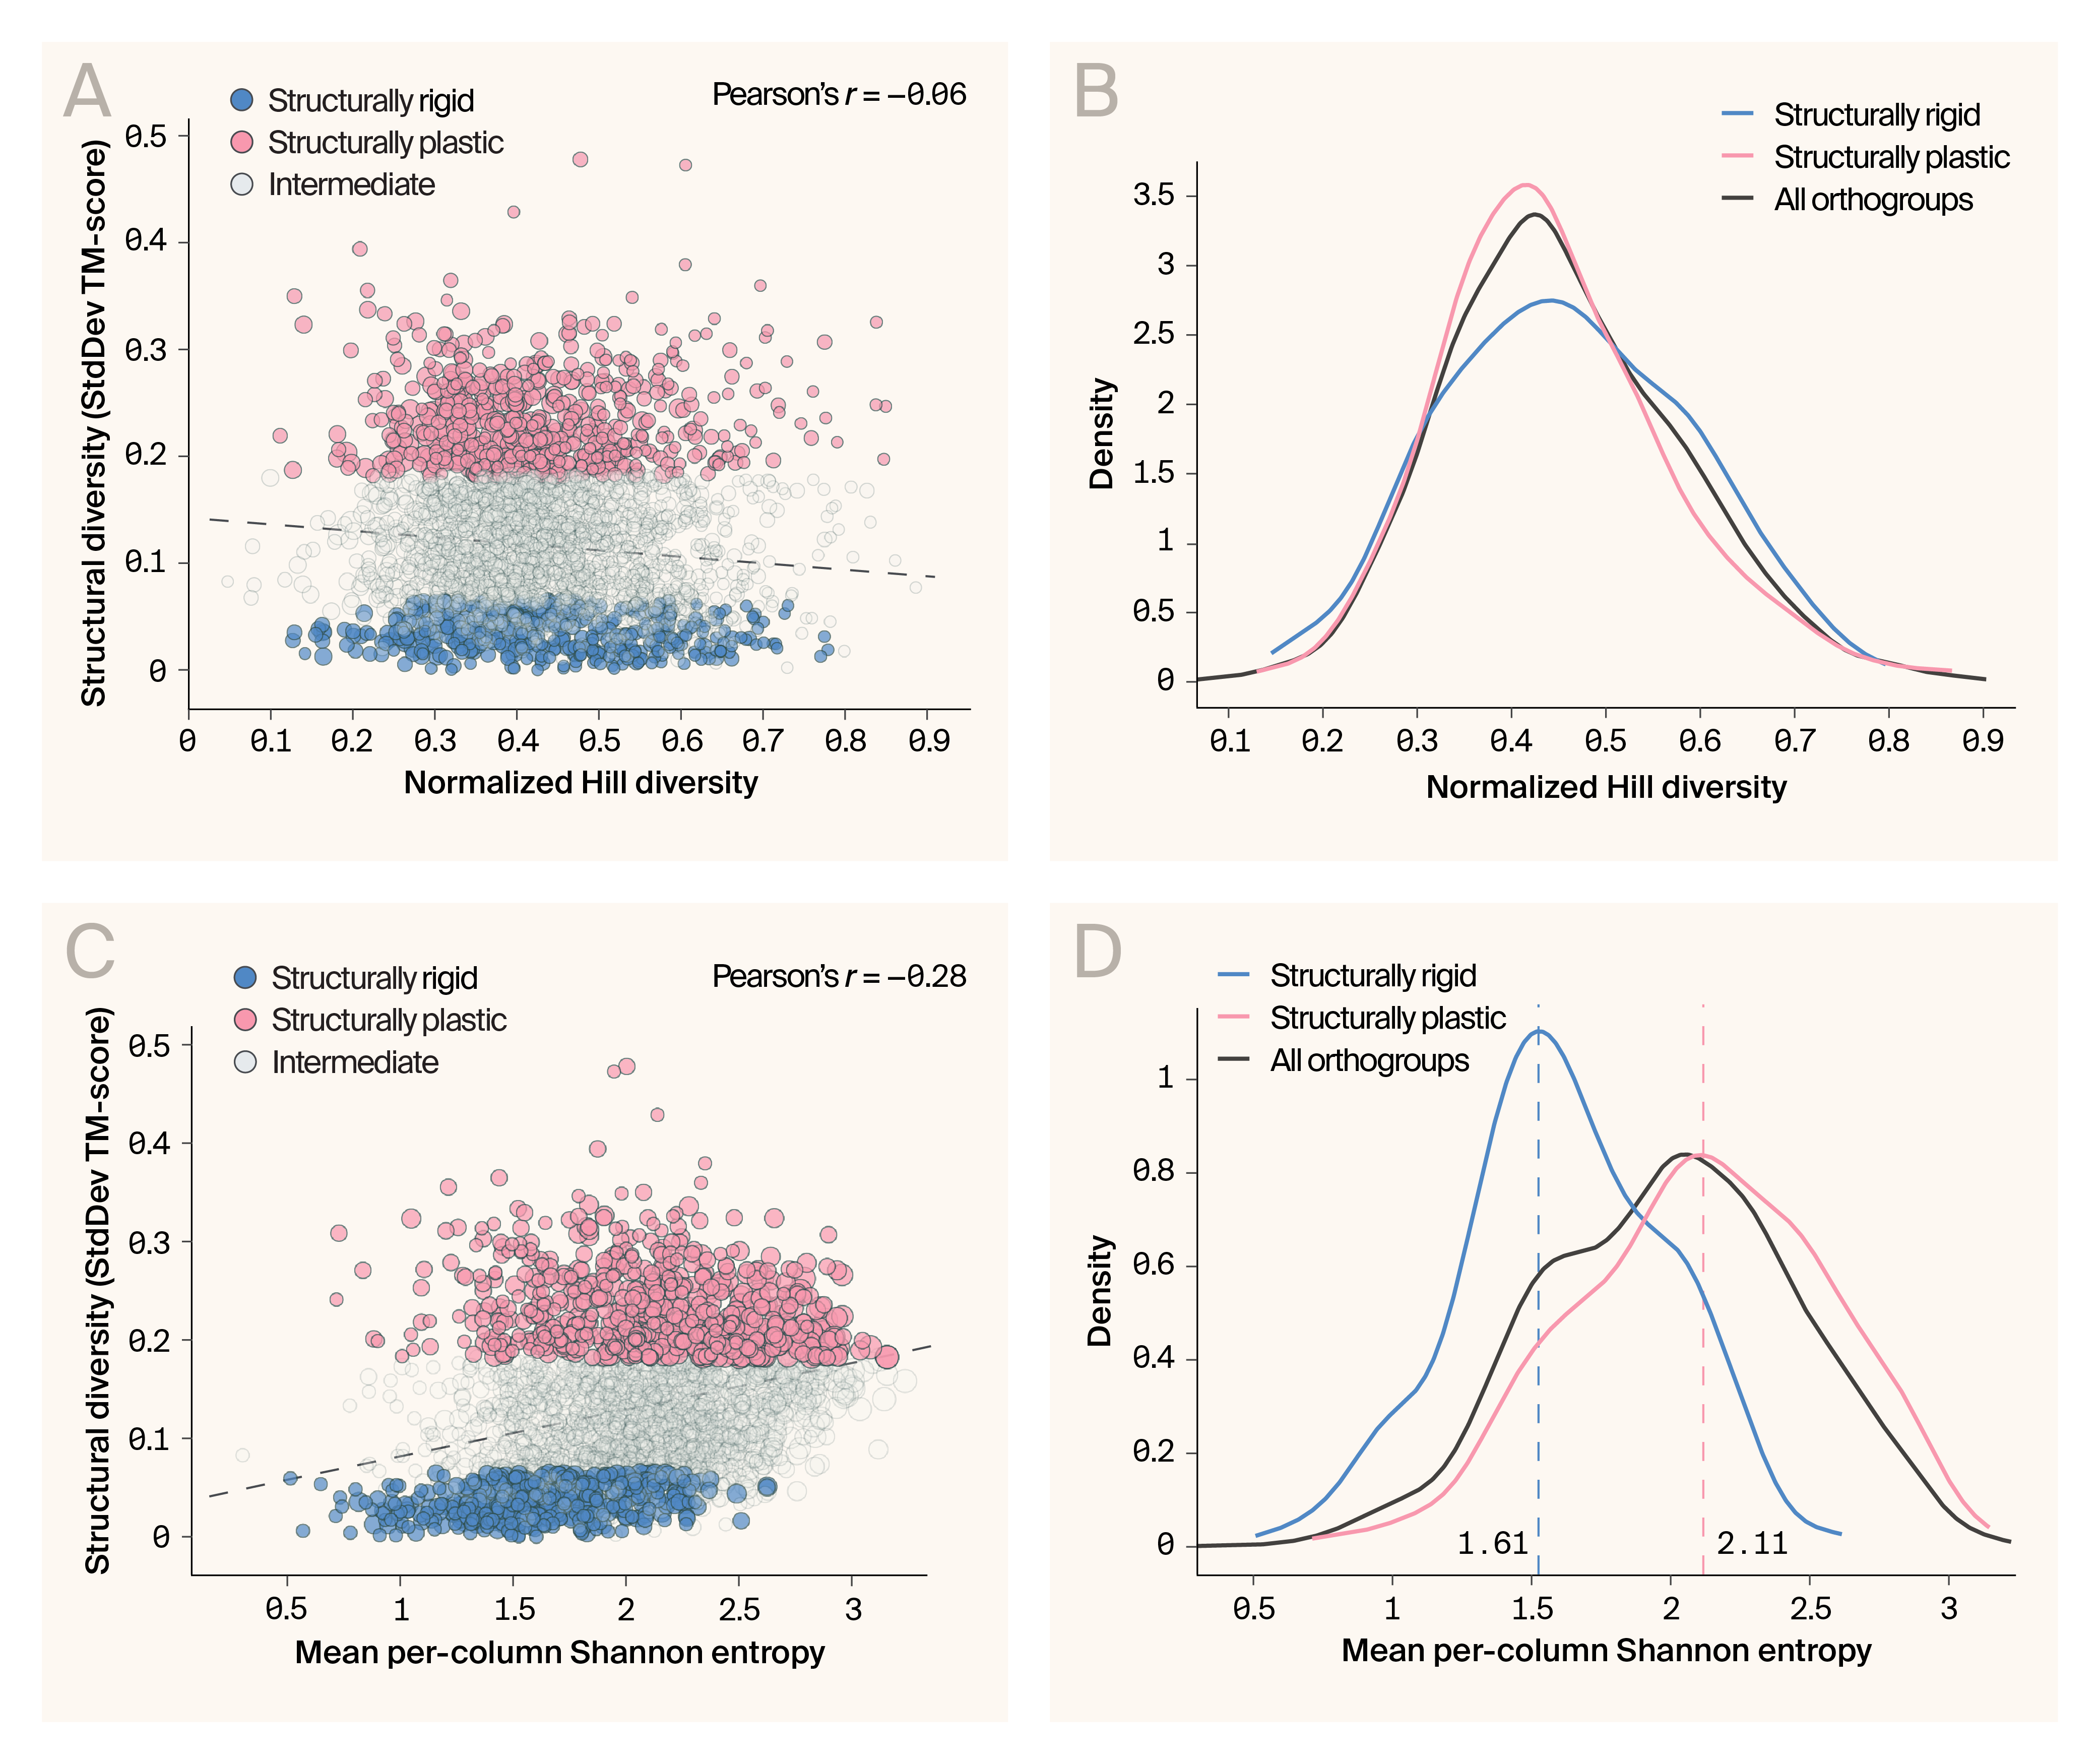
Multiple diversity metrics confirm structural category distinctions.
(A) Structural diversity versus normalized Hill Diversity shows minimal correlation (r = −0.06) but clear separation between structural profiles.
(B) Normalized Hill Diversity density distributions differ markedly between rigid and plastic families.
(C) Structural diversity versus per-column Shannon entropy reveals moderate correlation (r = 0.28).
(D) Shannon entropy distributions highlight conservation differences, with rigid families showing distinct patterns.
Rigid and plastic protein families don’t differ in domain number or intrinsic disorder
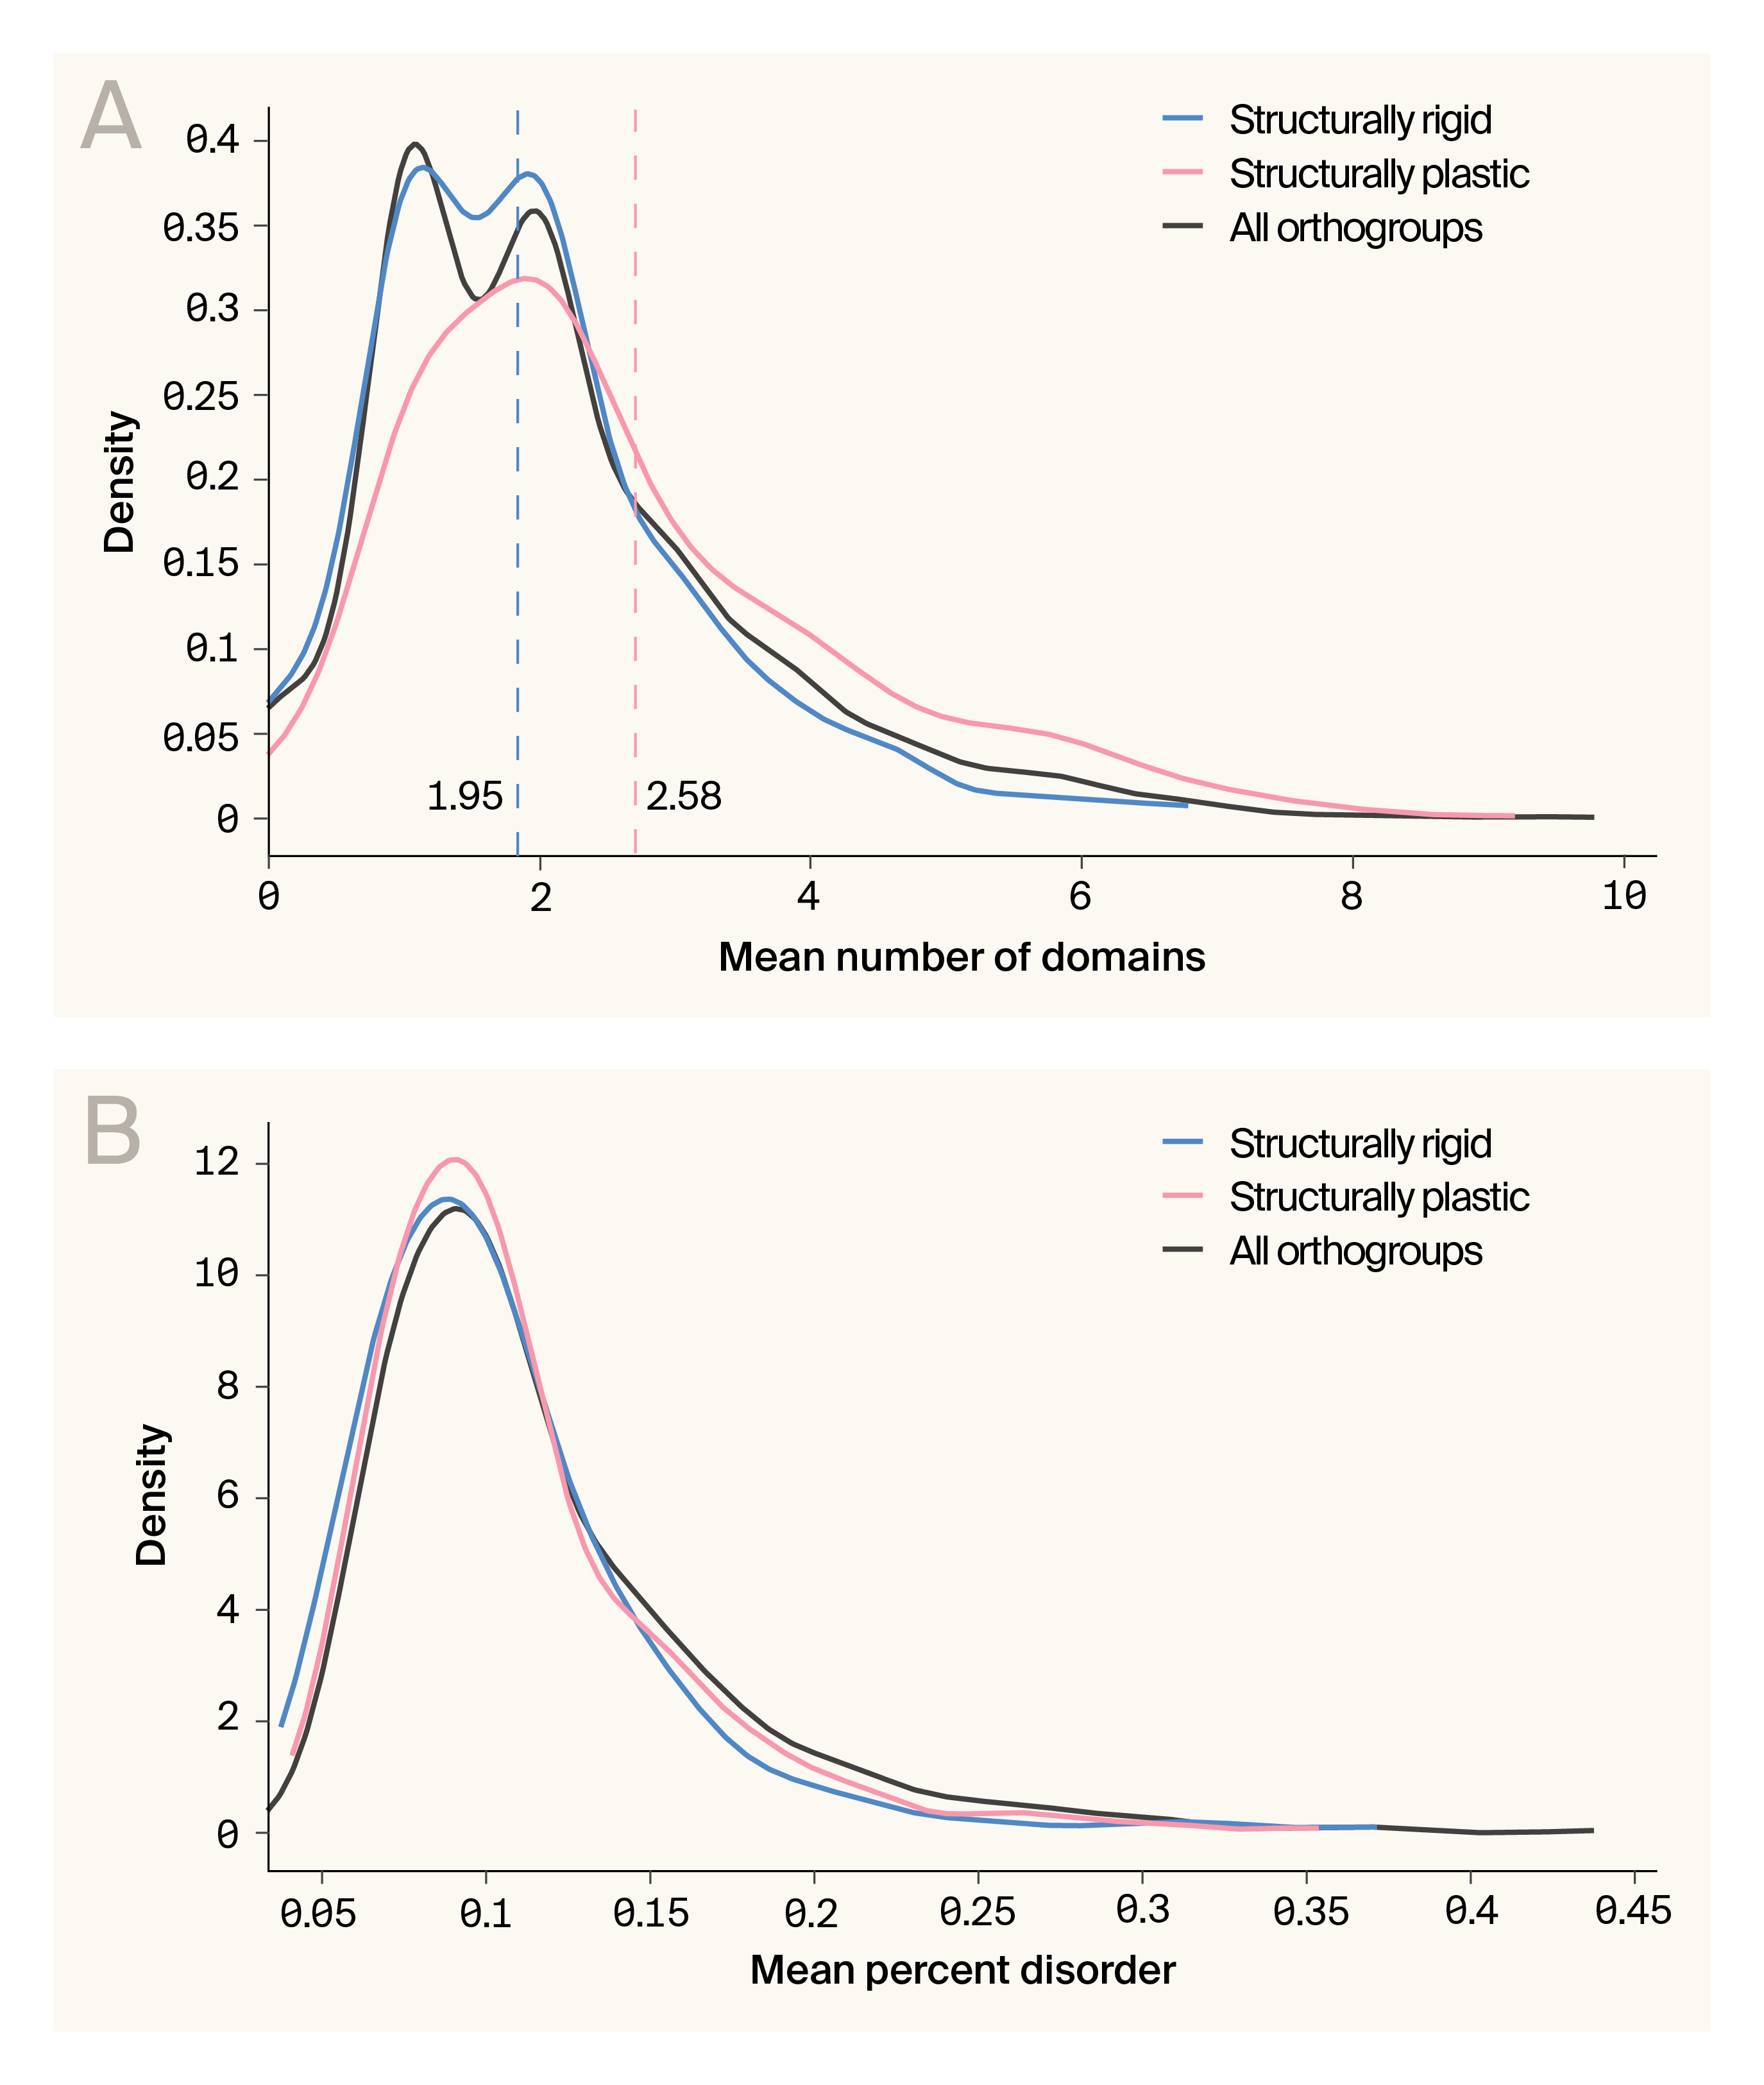
Domain architecture, but not intrinsic disorder, distinguishes structurally rigid families.
(A) Domain count distributions show structurally rigid families are biased toward simpler architectures (mean = 1.95 domains) compared to plastic families (mean = 2.59 domains).
(B) Intrinsic disorder distributions are remarkably similar between categories, suggesting disorder content doesn't predict structural rigidity.
Finally, we explored whether more complex domain architectures or intrinsic disorder are linked to structural conservation. Structurally rigid families have a significantly lower mean number of domains per protein (1.95) than structurally plastic ones (2.59) (p = 5.8e−12; Kolmogorov-Smirnov test), but with a modest effect size (Cohen’s d = −0.43) (Figure 3, A). Intrinsic disorder also doesn’t meaningfully distinguish the structurally rigid families from others in the dataset (Figure 3, B), suggesting that the determinants of structural conservation are more likely to be specific architectural or sequence features, not broad properties like disorder or the number of domains.
Key takeaways
Our analysis of 4,064 Asgard protein families reveals that while most families at least loosely follow predictable sequence–structure relationships, there's a statistically identifiable population of structurally conserved families with broad sequence divergence. In some cases, this small subset displays sequence–structure decoupling, maintaining fold even when sequence identity drops below 35%. Among Asgard archaea, at least, extensive sequence variation doesn't necessarily destabilize protein folds, and some sequence-diverse protein families exhibit near-perfect structural conservation despite being ancient and broadly distributed across the phylogeny. This variation highlights that various sequences can encode standard structural features, suggesting that some form of constraint (e.g., biophysical or evolutionary) has continually acted on these families to generate structural conservation.
More systematic approaches may elucidate the nature of these constraints. In this case, domain number and intrinsic disorder didn’t have clear explanatory power, suggesting that more nuanced patterns of local variation are likely at play. Given this, and the broad continuum of patterns observed here, we decided that identifying the molecular mechanisms of this conservation was outside this project's scope. These results suggest that, while statistically distinct populations of the protein universe can be identified, one-size-fits-all models will continually fail to capture the breadth of observed sequence–structure relationships.
Next steps
While this analysis has successfully identified protein families with unexpected sequence–structure relationships, we’ve decided to leave our current efforts here. A proper follow-up may involve generating models that integrate structural, evolutionary, and sequence information to flexibly capture the diversity of patterns present in the archaeal protein universe.
For the broader research community, several directions could yield significant insights. Comparing the patterns identified here with those present in other taxa could help identify archaeal-specific novelties. Developing computational tools to identify structurally rigid families from sequence alone would accelerate the discovery of robust protein scaffolds for engineering applications. Finally, the protein families we've identified represent a unique resource for understanding protein evolution — they're natural experiments in maintaining function while exploring vast expanses of sequence space.
References
Share your thoughts!
Feel free to provide feedback by commenting in the box at the bottom of this page or by posting about this work on social media. Please make all feedback public so other readers can benefit from the discussion.
