 Published on Aug 15, 2025 by Arcadia Science
 Automating identification and quantification of mouse scratch behavior in video recordings
Contributors (A-Z)
Automating identification and quantification of mouse scratch behavior in video recordings
Purpose
We sought to speed drug discovery by building an end-to-end video analysis pipeline to assess itch in mice treated with itch-inducing substances (pruritogens) and tick extracts that contain compounds that may alleviate itch. The pipeline leverages machine learning (ML)-based pose estimation to track mouse scratching behavior and automation in the cloud to accelerate analysis.
This resource might be useful to researchers working on itch, applying ML-based models to assess other behavioral readouts, or hoping to extract general lessons for productionizing ML workflows in the cloud.
- All associated code is available in this GitHub repository.
- Check out our protocol, “A behavioral assay for measuring acute itch in mice,” for step-by-step instructions to carry out the upstream scratch assay and generate the videos that feed into this computational pipeline.
Share your thoughts!
Feel free to provide feedback by commenting in the box at the bottom of this page or by posting about this work on social media. Please make all feedback public so other readers can benefit from the discussion.
The strategy
The problem
Itch is a debilitating symptom and driver of numerous diseases that have a devastating impact on physical and emotional health. Being able to categorize and quantify itch is necessary to assess disease progression and the efficacy of treatment for itch-associated diseases. The gold standard for quantifying itch in preclinical translational models has been human observation and tallying of itch-specific behaviors from video recordings, specifically pruritogen-induced scratching in mouse models [1].
Mouse scratching has traditionally been quantified through manual annotation of mouse videos, counting mouse paw swipes across affected areas. This approach has translated reasonably well to human clinical phenotypes [2], although the process of manual annotation can be slow and tedious. Given our goal of using behavioral phenotyping as a guide for our fractionation experiments, we needed ways to speed up our in vivo analyses.
Our solution
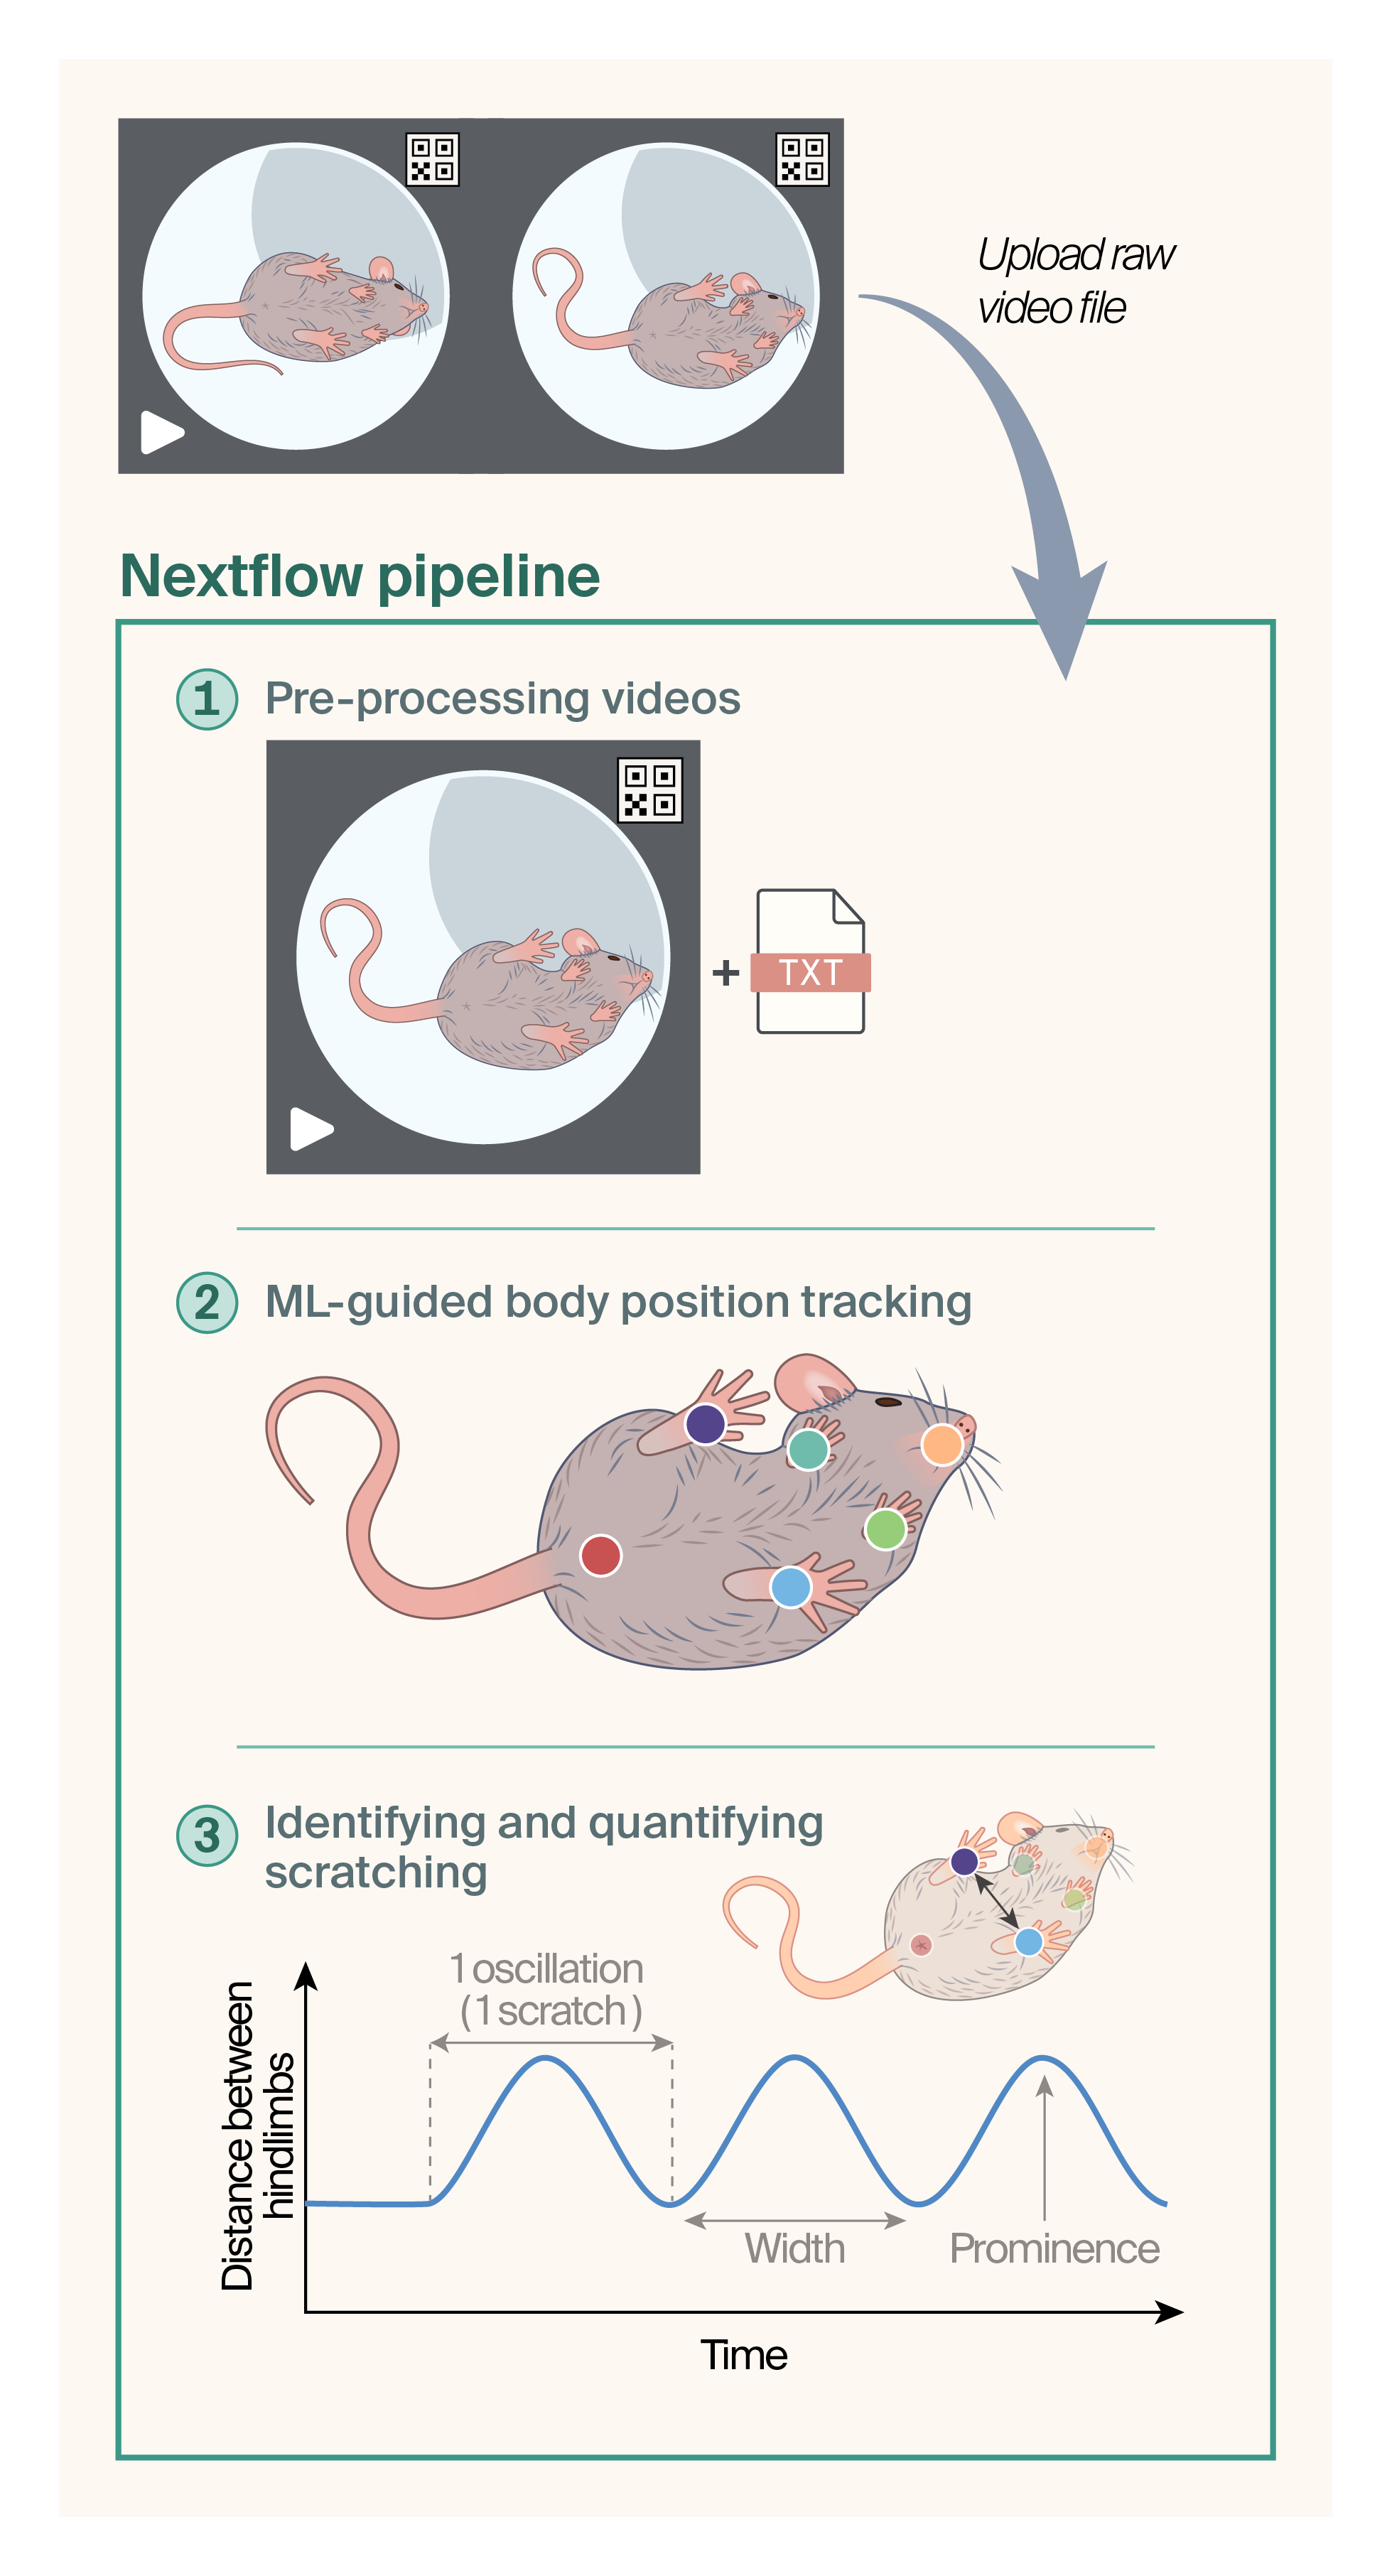
Schematic of automated workflow for the analysis of mouse scratching.
We uploaded unprocessed video files and their matching metadata (TXT) files to AWS, where we triggered the NextFlow workflow. We cropped the files to include only one mouse per video and renamed them based on the data in the metadata file (time, date, camera, frame of capture). We then used DeepLabCut to track the six body parts, indicated by the colored circles. We processed the output pose estimation data from DLC with a peak-finding script to identify and quantify episodes of scratching. The script looks at the difference in x,y positions between the two rear hindlimbs to identify the stereotypical cyclical movement pattern of the scratching motion.
To accelerate our studies on anti-itch compounds, we built a computational pipeline to automate the steps involved in quantifying mouse scratching (please check out our companion protocol on how to perform the mouse scratch assay). Here, we present the workflow and code we developed. We estimate that it ultimately sped up our data analysis by at least 50×. One limitation, however, is that our pipeline performs well only on DBA/2J mice, which have unique coloration patterns. Further work is necessary to make it generalizable for all mice.
Others have also developed ML-based training sets to track and quantify scratching in rodents [3][4]. While tracking mice using ML-based algorithms isn't a new tool to aid in scratch quantification, automating the different arms of the process in the cloud was unique and a game-changer for decreasing our analysis time between experiments.
We built this pipeline to quantify scratching in mice, but we recognize that there are other, less-appreciated, itch-related behaviors that aren't categorized as scratching. Since the pipeline provides positional data for numerous body parts of the mouse, we hope others will use it to identify and track metrics besides scratching using unbiased ML-based clustering algorithms.
Figure 1 outlines the pipeline. It automates video cropping and cataloging, body position tracking using DeepLabCut, and scratch quantification.
The resource
Code, including the NextFlow workflow, packages to preprocess videos and analyze them with DLC, and the peak-finding scripts, is available in our GitHub repo (DOI: 10.5281/zenodo.16879067).
In this section, we dive into the details of our automated scratch assay analysis pipeline. Figure 1 outlines the key steps of the computational analysis.
Preprocessing videos
We treated DBA/2J mice with pruritogens (itch inducers) and captured videos of their behavior (see our protocol for this assay on protocols.io). Each video captured two mice. To unambiguously catalog each mouse recording, we subjected videos containing two mice to automated cropping into two videos containing one mouse each (Figure 1, top panel). We renamed these videos based on position in the frame (right vs. left enclosure), capture time, and date. We affixed quick response (QR) codes just outside each mouse enclosure, and used a script to assign a 900 × 900 pixel bounding box based on the corner of the QR code to perform the video cropping. Two boxes defined two regions in the video to crop to generate two separate videos. We then extracted the video capture time and date from an associated metadata file and used them to rename the two cropped video files.
Training ML-guided body position tracking
We then employed automated, machine learning-guided body position tracking using DeepLabCut (v2.2.1, RRID: SCR_021391) [5]. We manually labeled six body parts, generating a skeleton of the front left paw, front right paw, rear left paw, rear right paw, nose, and rear of the animal. Some other studies [3] focus exclusively on labeling the limbs that perform the scratching, but miss out on tracking other possible behaviors that could be found by tracking many body parts. We performed training on an Intel Core i9 CPU system and a NVIDIA GeForce RTX 3080-10GB graphics card. We prepared a training dataset with the ResNet-50 convolutional neural network backbone [5], using 43 videos with 2,200 total frames, extracting an average of 50 frames per video to label the six body parts manually. We split the dataset 95:5 for training and testing, respectively. At each iteration of training, we extracted outlier frames, corrected labeling, and then used them to retrain. Using a confidence threshold of 0.6, training achieved an average train error of 0.32 mm (1.89 pixels) and average test error of 1.25 mm (7.39 pixels).
Identifying and quantifying scratching
We then used the pose estimation data to explore the most robust means to quantify scratching. Scratching in mice involves raising a right or left rear hindlimb to scratch the affected area [6]. When plotting the change in hindlimb x,y position over time, the cyclical nature of the scratching motion appears as a distinct oscillating curve (Figure 1, bottom panel). We empirically determined that the clearest scratching pattern (the greatest and most consistent difference in x,y positions over time) was revealed when plotting the difference in the positions of the right and left hindlimbs during scratching episodes.
We then wrote a Python peak-finding script to automatically identify the itch-associated cyclical hindlimb displacement pattern noted above. To accurately flag "waves" of rear hindlimb swipes in displacement-time graphs as scratching events, we included several key variables in the script (Figure 1, bottom panel):
- The minimum and maximum prominence of the peak
Peak prominence is a measure of how much a peak stands out from its surroundings by calculating the minimum vertical distance you need to descend from the apex of a peak before you could climb to an adjacent higher peak. - The minimum and maximum width of the peak
- The maximum frequency of the scratches
- The minimum number of oscillations of the curve within a given time, corresponding to the number of scratches across the neck in a time bin
This final metric allowed us to distinguish the repeated pattern of scratching from just random movement that may appear as less frequent oscillating displacement of the hindlimb (e.g., rapid walking).
We adjusted these parameters, generated output tables with predicted scratching events, and compared the predictions to ground-truth video footage and manual quantification to confirm that the automated calls were correct. After some iteration, we determined how to adjust the variable settings to call scratching events accurately.
Using this script, we were able to capture the following data (with precision dictated by the video capture rate of 1/120 of a second):
- Which limb is performing the scratching
- Individual hindlimb swipes at the affected area
- Number of swipes in a bout of scratching
- Frequency of swipes and frequency of bouts of scratching.
Overall, these measures help capture the dynamics of scratching across the entire time course of the video.
NextFlow workflow to orchestrate the analysis pipeline in AWS
With all the different modules of the analysis pipeline complete, we wanted to take advantage of the parallel processing power available in the cloud to further speed up the video analysis. We ported the modules to Amazon Web Services (AWS) and built a workflow using NextFlow to orchestrate the pipeline.
The NextFlow workflow is available in our GitHub repo.
Findings and caveats
The outcome of this effort was automation and parallel processing of analysis that significantly accelerated the quantification of scratching and allowed rapid and nearly real-time adjustment of experimental parameters for follow-up experiments. Less than a day after an experiment was complete, we would have the results and could perform the next experiment.
Direct comparison of manual quantification time to automated quantification is difficult because a huge efficiency gain came from running the automated analysis in parallel with many videos. However, a good approximation can be made by comparing the analysis time for an average single experiment of 48 15-minute videos. Quantifying 48 videos took approximately 36 hours, which generally spanned seven days. With the automated pipeline, 48 videos could be processed in three hours (~56× faster).
As noted by others [4], ML-based training weights for pose estimation are sensitive to the specific conditions in the video (lighting, camera resolution, camera angle, frame rate, etc.). For instance, our pipeline successfully tracks mice with coloration patterns specific to DBA/2J mice. Re-training and fine-tuning will be necessary to generalize to other mouse breeds that are visually distinct from DBA/2J mice. Additionally, slight variations in our experimental setup (described here), may also require re-training.
Additional methods
We used ChatGPT to review our code and selectively incorporated its feedback. We used Claude to review our code, selectively incorporating its feedback, and to help clarify and streamline text that we wrote. We also used Grammarly Business to suggest wording ideas and then chose which small phrases or sentence structure ideas to use.
Key takeaways
In summary, we built a video analysis pipeline to quantify itch in mice treated with itch-inducing substances and potential anti-itch compounds. Our pipeline significantly accelerates video analysis and removes the variation inherent in using different human observers in the same experiment. It also yields more granular data, such as scratching frequency. Additionally, it provides the framework to use positional data and non-scratching behavioral information to track other outcomes of experimental treatments.
Next steps
We’re currently winding down the Trove effort [7], so we won’t continue development of this resource. For those who may want to use this tool, further work should be done to generalize ML training to follow mouse strains other than those with DBA/2J coloration patterns. Further optimization of GPU use in the cloud could also increase efficiency and decrease the analysis time.
Unsupervised ML-based algorithms [8][9] could also be used with our positional data to identify emergent behavioral patterns caused by treatment regimes. These emergent behaviors could provide another metric to follow that may display less variability mouse-to-mouse than scratching.
- Acknowledgments
- We’d like to thank Alan Basbaum and Juan Salvatierra for suggestions on mouse recordings and strategies for generating the training weights with DLC.
References
Share your thoughts!
Feel free to provide feedback by commenting in the box at the bottom of this page or by posting about this work on social media. Please make all feedback public so other readers can benefit from the discussion.
