 Published on Sep 09, 2025 by Arcadia Science
 AutoOpenRaman: Low-cost, automated Raman spectroscopy
Contributors (A-Z)
AutoOpenRaman: Low-cost, automated Raman spectroscopy
Purpose
Our goal was to add automation to an open-source Raman spectrometer (OpenRAMAN) to use it for high-throughput data collection from biological samples. Additionally, we wanted to keep the open and accessible spirit of the original OpenRAMAN by using inexpensive components and open-source software.
Thus, we present AutoOpenRaman, an open-source, automated, and affordable Raman spectrometer. This resource will be helpful for current users of OpenRAMAN who want to automate their experiments, in addition to scientists who wish to evaluate Raman spectroscopy for their application without purchasing an expensive commercial system. We hope that AutoOpenRaman can expand the OpenRAMAN community by allowing scientists to conduct a wider variety of experiments.
- All code and data associated with this pub are available in this GitHub repository.
- The parts list to assemble the instrument is available here.
- Design files for the entire instrument and the laser shutter are available on Thingiverse or NIH 3D.
Share your thoughts!
Feel free to provide feedback by commenting in the box at the bottom of this page or by posting about this work on social media. Please make all feedback public so other readers can benefit from the discussion.
The strategy
Raman spectroscopy has been gaining traction in biology because it enables the analysis of the chemical composition of a sample in a label-free and non-destructive manner. This technique allows researchers to study organisms without altering or damaging them, making it possible to study organisms across time, in response to perturbations, or in combination with other tools such as fluorescence microscopy. In previous work, we found that Raman spectra may encode information relevant to the taxonomic relationships among organisms [1]. Similarly, other groups have found Raman spectra to contain information about genetic expression profiles [2], phylogenetic background [3][4], and physiological state [5][6]. To build on these findings, we want to enable the collection of Raman spectra from a wide range of organisms representing differing amounts of genetic variation from many major lineages across the tree of life. The unbiased, label-free nature of Raman spectroscopy could enhance our understanding of the phylogenetic and genetic relationships between organisms.
The problem
We realized that automating Raman spectroscopy is essential to achieving the automation we’d need to reach our large-scale phenotyping goals. Moreover, various experiments we’d need to do may require adding devices such as lights, syringe pumps, or cameras to a Raman spectroscopy system. Commercial Raman systems like the HORIBA LabRam, Renishaw InVia Qontor, WITec alpha300 R, and others offer motorized stages and software that allow walk-away automation; however, they're expensive ($200k+) and often challenging to integrate with other devices. An open-source solution called OpenRAMAN is a powerful, inexpensive DIY alternative; however, it doesn't support automation, and the software isn't amenable to modifications. We sought to fill this gap by developing hardware and software based on OpenRAMAN that's automated and synchronized with additional devices.
Our solution
AutoOpenRaman consists of the following components:
Hardware:
- OpenRAMAN spectrometer to acquire Raman spectra
- Motorized XY stage for automation of sample movement
- Sample visualization objective to deliver laser light and collect light from the sample
- Manual Z stage to focus the objective
- Shutter to gate the laser light for time-lapse experiments
- Neon light source for quick wavelength/wavenumber calibration
- Basic enclosure to reduce light contamination
Software:
- Modern Python-based graphical user interface (GUI) that requires no coding experience to install and run
- Integration with Pycro-Manager/µManager for enhanced device support and automation
All code and data associated with this pub are available on GitHub (DOI: 10.5281/zenodo.15802365)
In total, the system components amount to approximately $8,000, including the spectrometer itself, which is significantly less than commercial systems that provide comparable functionalities. Download our bill of materials here, which contains the detailed cost breakdown.
By developing AutoOpenRaman, we hope to lower the barrier to entry for scientists who want to try out Raman spectroscopy for their research without committing to expensive instrumentation. Importantly, users don't have to purchase the specific devices that we used; as long as µManager supports the chosen alternatives (see Software), you can use them with few to no changes to the source code. We also encourage further development and improvements to AutoOpenRaman by providing open-source, modern software that you can modify to accommodate a wide range of experiments.
The resource
Here, we provide an overview of the AutoOpenRaman hardware and software (Figure 1, A). If you’ve never used OpenRAMAN before, we recommend first building it using the instructions for the Starter Edition or the Performance Edition on the OpenRAMAN website. If you have an existing OpenRAMAN setup, start with the modifications below.
PRINT IT: Download a 3D model of the assembled instrument from Thingiverse or NIH 3D (3DPX: 022927).
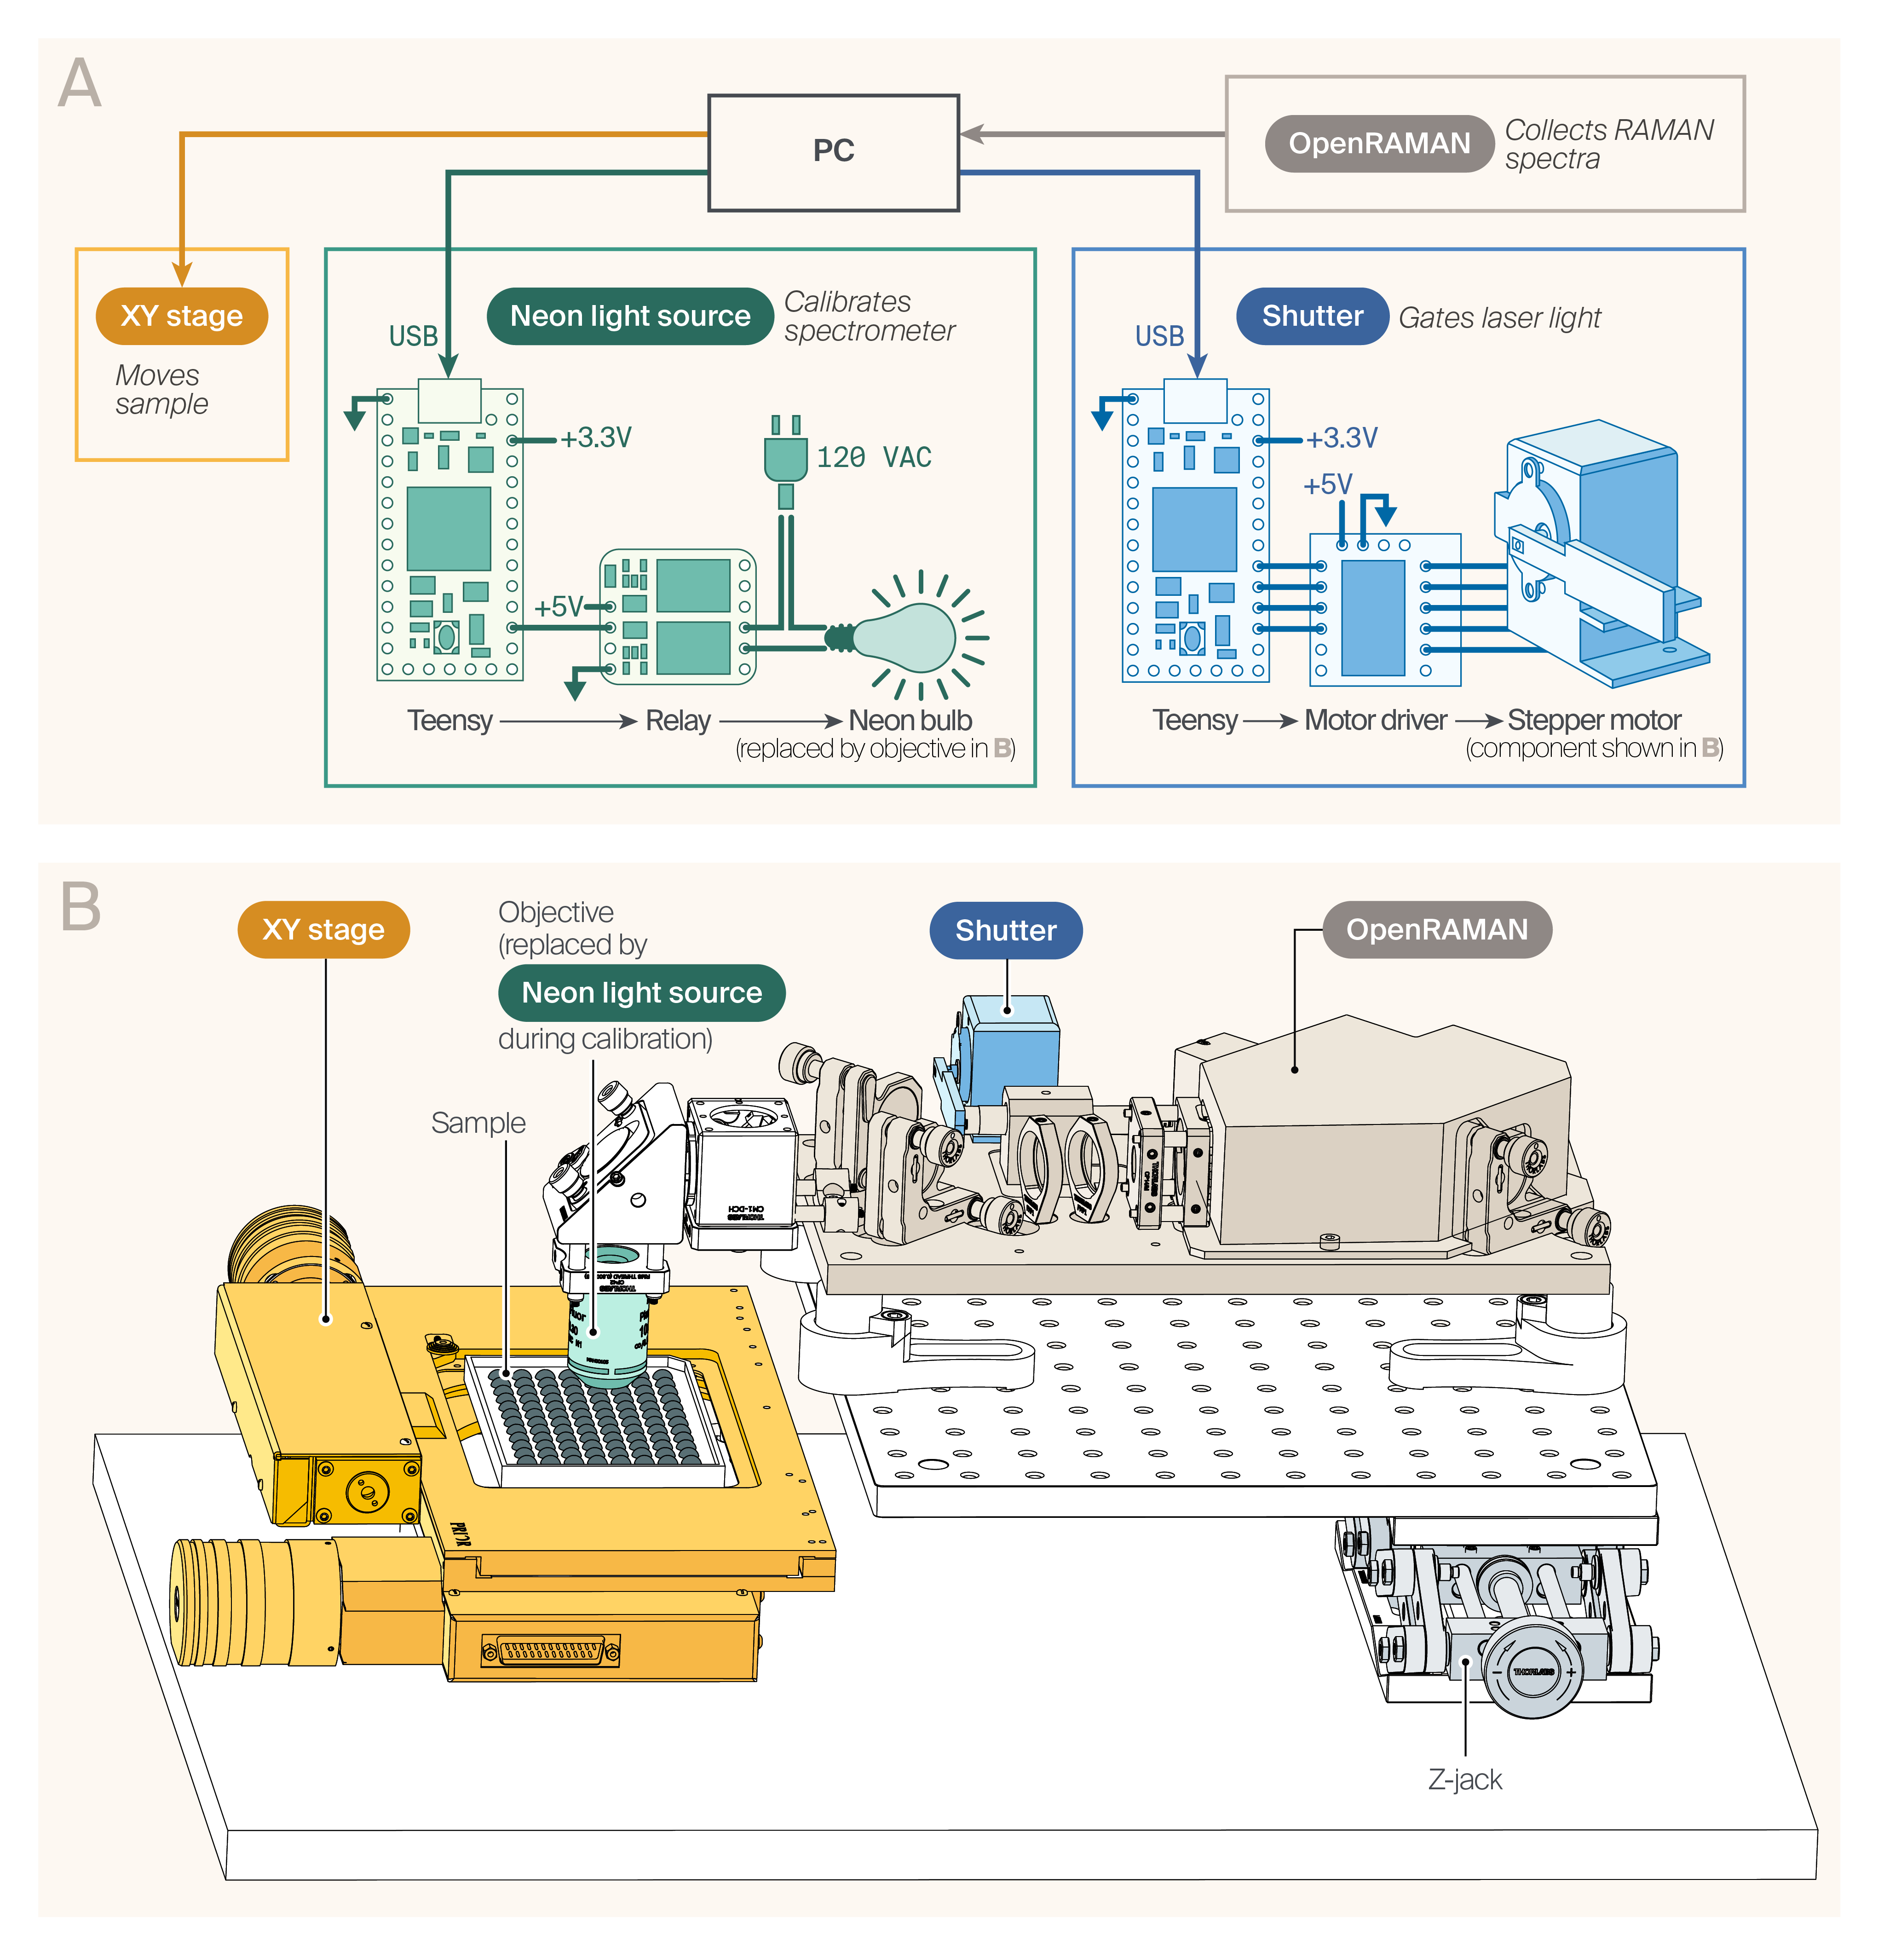
AutoOpenRaman hardware.
(A) Hardware diagram. The OpenRAMAN spectrometer acquires Raman spectra from the sample mounted on a motorized XY stage. Custom-built shutter and neon light source provide additional functionality.
(B) Computer-assisted design (CAD) model of the AutoOpenRaman instrument.
Hardware
The key hardware components for the instrument are the OpenRAMAN spectrometer, XY stage for moving the sample, shutter for gating the laser light, and neon light source for calibration (Figure 1, B). The details of assembling these components are below.
Automated Raman spectroscopy
To enable AutoOpenRaman to focus on samples on the XY stage, you first need to replace the cuvette holder from the original build with a microscope objective. First, attach a mirror (PF10-03-P01; Thorlabs) to a holder (KCB1; Thorlabs) and mount the holder in place of the cuvette holder in the OpenRAMAN assembly. Mount a Nikon Plan Apo λ 4×/0.20 NA microscope objective (you can also use a less expensive alternative if needed) on a compatible threaded cage plate (e.g., CP42; Thorlabs) and attach the cage plate to the sample-facing side of KCB1 using cage rods (EC1; Thorlabs). The spectrometer can now collect measurements from samples under the objective.
Mount the OpenRAMAN spectrometer on a small optical breadboard (e.g., MB3030/M; Thorlabs) using four pillars (RS38P4; Thorlabs) and pillar holders (RB2; Thorlabs) and secure the breadboard to a lab jack (L490; Thorlabs). The spectrometer can now move up and down to focus on the sample.
Next, install a motorized XY stage. We used H7550T from Prior Scientific, but you can find other cheap ones on eBay, as long as µManager supports them. The sample can now move laterally in an automated fashion.
Time-lapse acquisition
If you want to limit sample exposure to light during a long, time-lapse acquisition, add a simple laser shutter. First, 3D-print the shutter paddle and holder (see design files). Mount the paddle to the shaft of a stepper motor (Adafruit #918). Then, attach the stepper motor to the OpenRAMAN base using the 3D-printed holder. Use a Teensy 4.0 microcontroller (DigiKey) to control the shutter motor (see Arduino code). The computer running µManager will send open/close commands via the serial COM port to the Teensy, which drives the motor accordingly.
Wavenumber calibration
The strong spectral lines of a neon light source are ideal for wavenumber calibration of the OpenRAMAN spectrometer. Commercial calibration devices are preferred for highly sensitive measurements, but an inexpensive custom-built solution was sufficient for our purposes. Couple a neon panel indicator light (1050QC2; DigiKey) to the end of a Thorlabs M53L02 fiber optic patch cable using a cage-mounted adapter (SM1FC2; Thorlabs). Couple the other end of the patch cable to another cage-mounted adapter. Power the light using 120VAC via a relay (B00E0NTPP4; Amazon) controlled by the Teensy (see Arduino code). As with the shutter, µManager will send on/off commands to the Teensy, which toggles the relay and activates the light.
Finally, house the electronics for the shutter and neon light source in plastic project boxes (Amazon B08P55BZDH). Enclose the full AutoOpenRaman setup using aluminum extrusion (McMaster-Carr 5537T926) and black cardboard to minimize stray light and ensure laser safety.
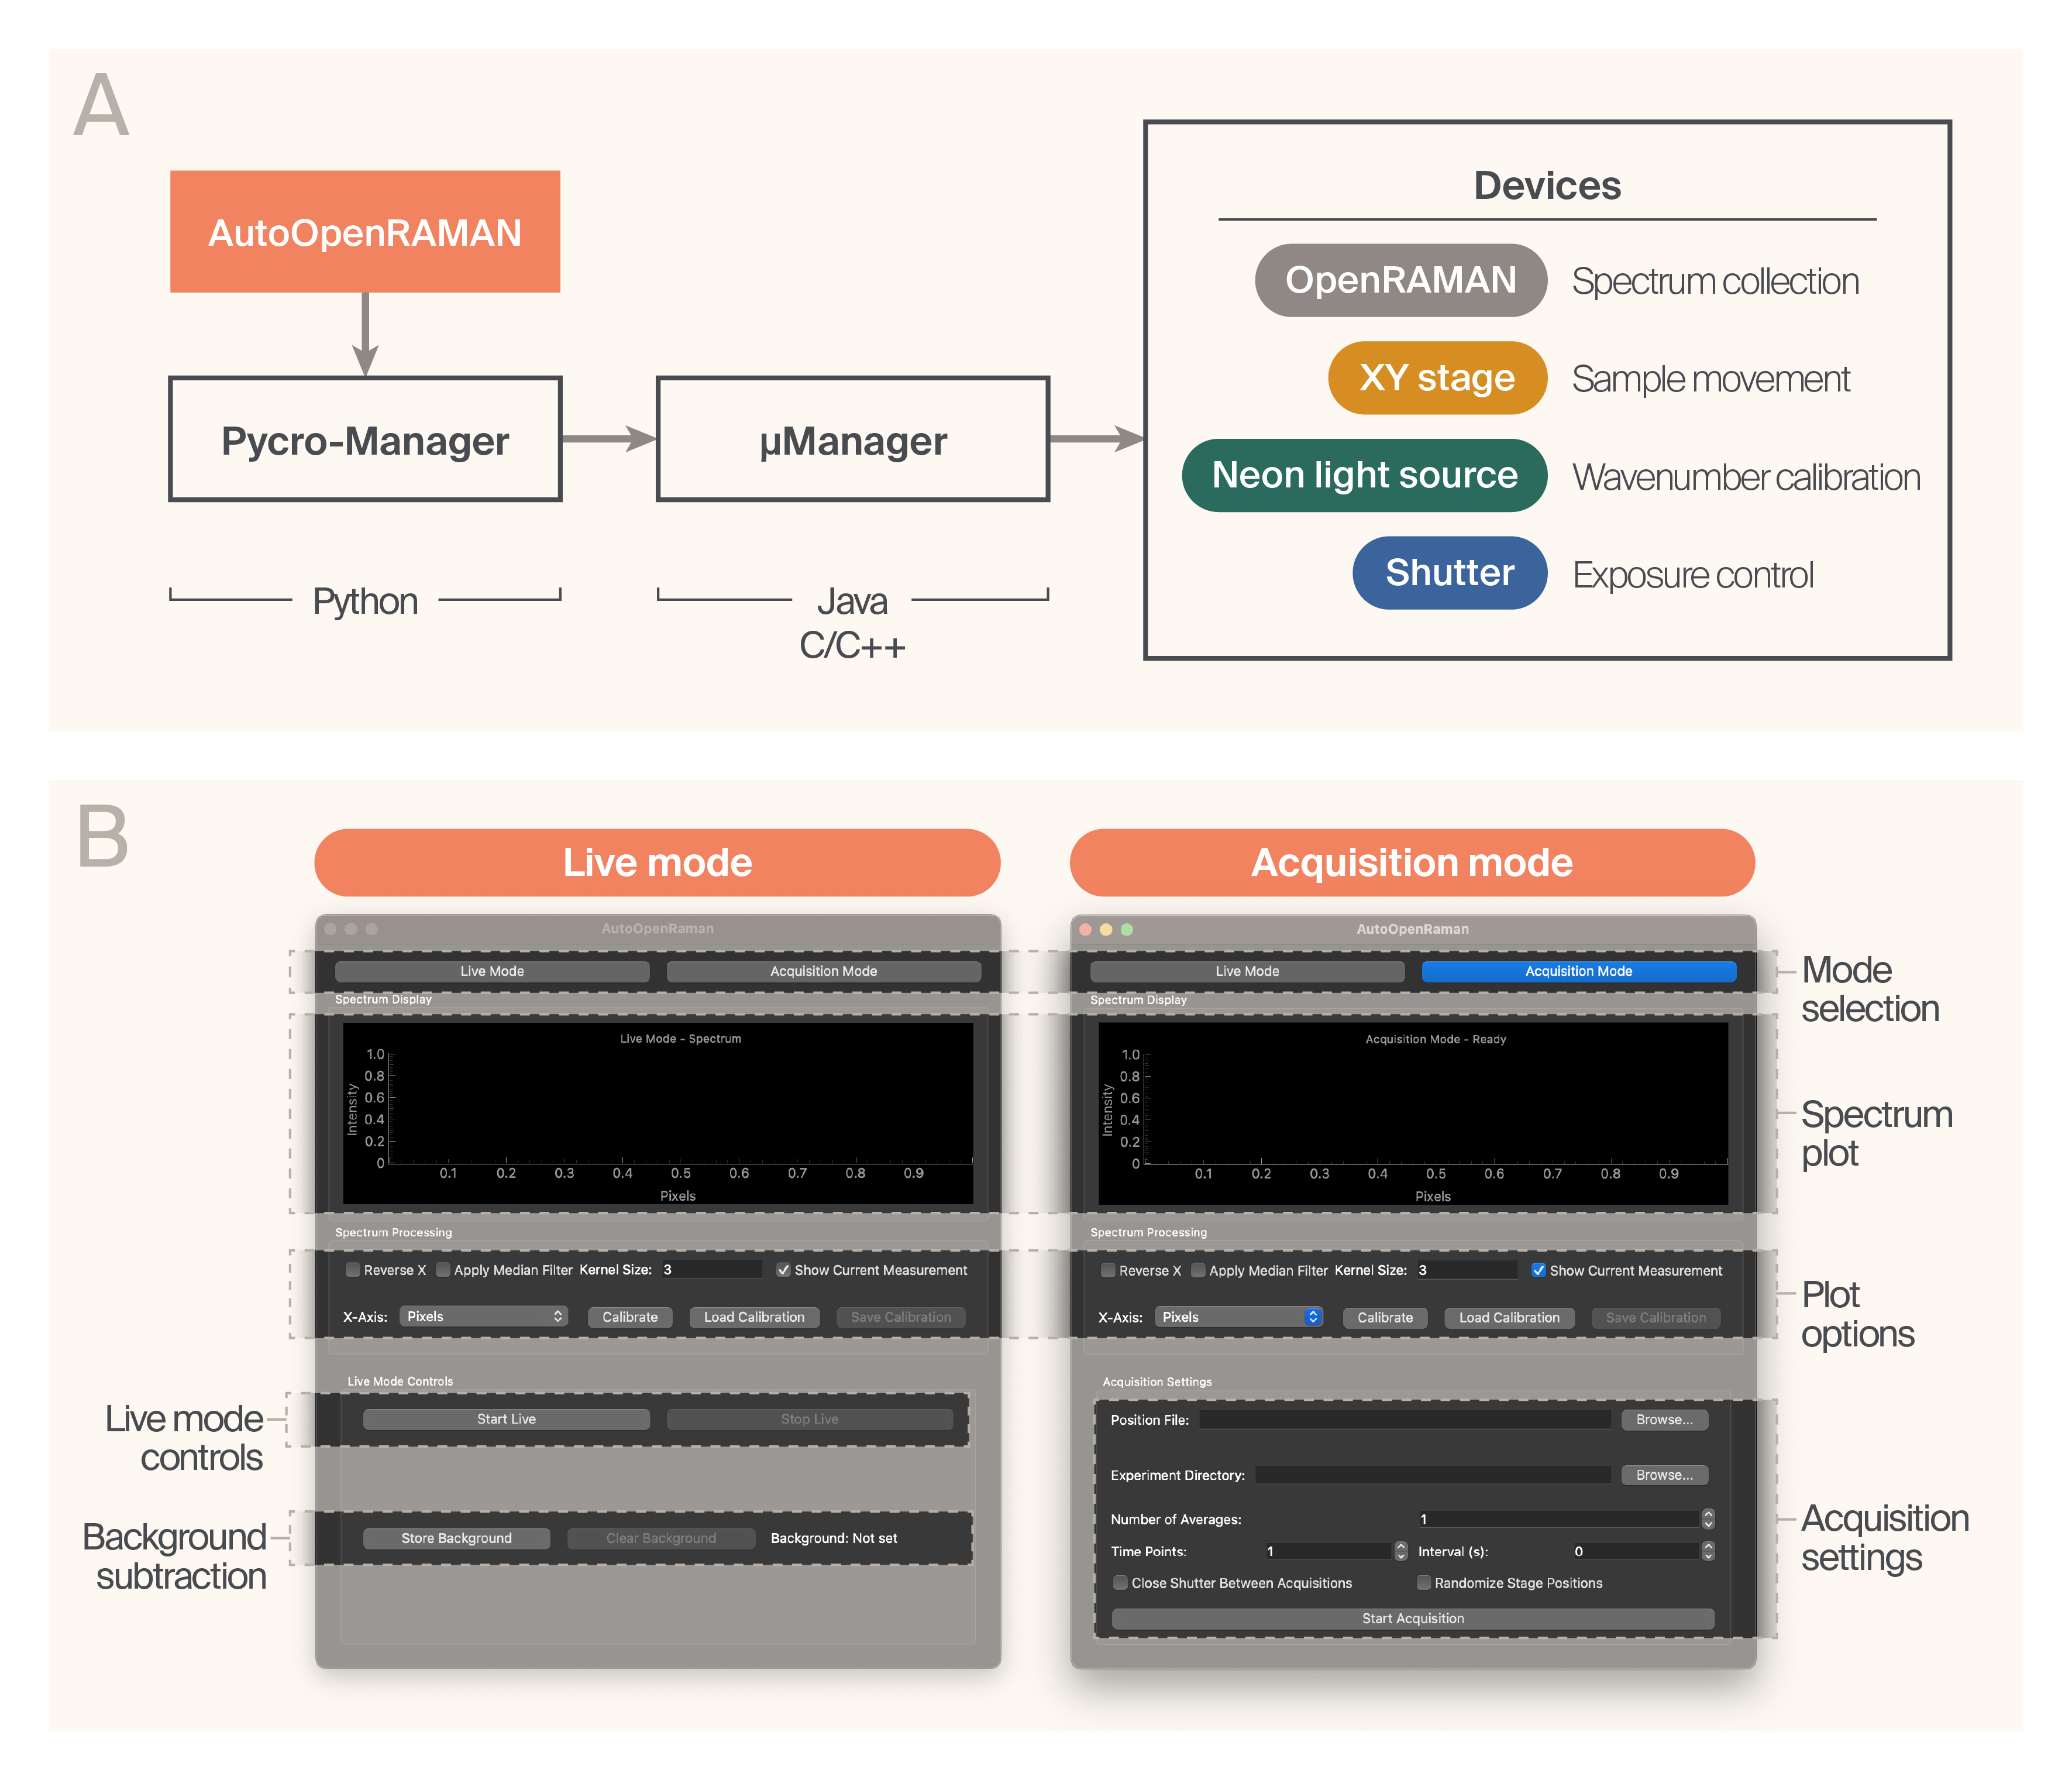
Software architecture.
(A) AutoOpenRaman is a Python package that controls and automates Raman spectrometers and other devices. It uses the Acquisition engine from Pycro-Manager to collect spectra across stage positions and time points, enabling automated data collection. Pycro-Manager uses µManager device drivers to interface with a large set of devices that enhance the function of OpenRAMAN.
(B) AutoOpenRaman GUI enables quick visualization of spectra (Live mode) and multi-dimensional acquisition (Acquisition mode).
Software
We designed the software to be easy for non-programmers to install and use while still allowing them to extend and modify it to add new functionality. Furthermore, we wanted the software to support various devices without relying on a specific manufacturer. To accomplish this, we used an architecture that relies on µManager (v2.0.3-20241016), a free, open-source microscopy control software [7][8] as a backend (Figure 2, A). µManager supports a broad range of devices, such as microscopes, cameras, light sources, and shutters from different manufacturers; this means that AutoOpenRaman can also be flexible with hardware. For example, while we use an XY stage from Prior Scientific in our setup, AutoOpenRaman users can implement other stages (provided µManager supports them) with no modifications to the code. The same can be done with other hardware, even the camera used for OpenRAMAN. This way, users can choose hardware based on availability, cost, and the specifics of their applications.
To maximize the utility and reusability of our work, we wrote the AutoOpenRaman software in Python. We used Pycro-Manager (v1.0.0) [9] as a bridge between our GUI and µManager. Pycro-Manager provides access to all device drivers supported by µManager, with the benefit of a programmable Python-based acquisition engine. Our GUI (based on PyQt5) allows for acquisition in “Live mode,” which helps find the sample and focus on it quickly, as well as in “Acquisition mode,” where you can collect actual data (Figure 2, B). We’ve successfully tested AutoOpenRaman on Windows and Mac; however, we note that the camera used for OpenRAMAN (along with many other devices) isn't Mac-compatible.
AutoOpenRaman operation
First-time experimental setup
- Download the entire AutoOpenRaman repository on GitHub and follow the installation instructions in the README.
- If running an experiment for the first time, follow the OpenRAMAN build instructions to ensure the system is properly aligned.
- Identify the optimal region of interest (ROI) of the OpenRAMAN camera within µManager by capturing an image of a sample spectrum and then modifying the ROI until it only includes the captured spectrum. After finding the optimal ROI, saving it as a preset is helpful to avoid resetting it every time you start a new session of µManager.
- If using additional hardware such as a shutter, ensure it's connected and controllable with µManager.
- Set up the hardware configuration file per the README.
Calibration
Proper spectrometer calibration is critical to data quality, so we added GUI elements to simplify this process. We used a two-step calibration procedure based on our previous work [10]. First, the software performs a rough calibration using a neon light source, and second, the user focuses the spectrometer on a cuvette of acetonitrile (360457-500ML; Millipore Sigma). Other standards can be used with modifications to the code (see README). To perform the pixel-wavenumber calibration:
- Set up the neon light source by replacing the microscope objective with the cage-mounted fiber adapter made earlier.
- Acquire and save a spectrum of the neon light source.
- Replace the neon light source with the microscope objective. Focus the spectrometer on a cuvette of acetonitrile. Acquire and save the spectrum.
- Click “Calibrate” in the GUI and browse to find the spectra created in steps 1 and 2. Then click “Calibrate” in the pop-up window to finish the calibration.
- In the main GUI, switch the x-axis from “Pixels” to “Wavenumbers (cm−1)”. Optionally, save the calibration to use it later.
If there are errors during the calibration, it's likely because the calibration peaks weren't properly detected. Refer to the “Troubleshooting” section of the README.
Running an experiment
- Ensure that the hardware configuration is correct and (if applicable) that you’ve applied the proper wavenumber calibration within the GUI.
- If running a multi-position experiment, generate the position file using µManager’s HCS Site Generator plugin.
- Use the AutoOpenRaman GUI to find your sample in Live mode.
- Switch to Acquisition mode and fill in the relevant experiment parameters such as the save directory, position file (created earlier), number of averages, and other parameters. Note that the spectrum integration time (i.e., the camera exposure time) must be set directly within µManager, not the AutoOpenRaman GUI.
- Click “Start Acquisition” to acquire the data.
Adding devices
Note
Adding devices requires familiarity with Python and (most likely) µManager.
Additional devices can be added via µManager. This is the preferred method, although it's also possible to communicate with additional devices directly via Python.
To add a device and control it via AutoOpenRaman, first add it in µManager. Then, determine how to access it using Pycro-Manager. The documentation helps determine the best way to do this. Pycro-Manager provides several ways to communicate with devices; for example, shutters can be accessed directly in Pycro-Manager using core.set_shutter(), while other devices may need to be controlled via calls to core.get_property(device_name). See the Pycro-Manager documentation for more information.
Once you’ve added devices in µManager and they’re accessible via Pycro-Manager, you can either add them to the AutoOpenRaman GUI or within the acquisition loop, depending on the need.
Automated Raman spectroscopy on a 96-well plate.
(A) A 96-colony plate of Chlamydomonas reinhardtii. The software collected spectra from a 5 × 5 grid of points per colony (right).
(B) Sped-up acquisition video of eight wells. The actual automated collection time for these wells was ~68 min (roughly 8.5 min/well).
(C) Representative Raman spectra from the wells collected in B.
(D) Result of the NMF algorithm (n = 5 components) applied to the full dataset (200 spectra), sorted top to bottom by maximum amplitude. The top component matches the spectrum of β-carotene.
Example use case: Automated Raman spectroscopy of Chlamydomonas reinhardtii colonies
To demonstrate AutoOpenRaman’s capabilities, we automatically acquired spectra from the single-cell algae Chlamydomonas reinhardtii. We grew the colonies on a single OmniTray single-well plate (ThermoScientific) of Tris-acetate-phosphate (TAP) media with 1.5% agar under 12-hour cyclic lighting at ambient temperature, stamped out in a 96-well plate format using an OT-2 (Opentrons Labworks Inc.) liquid-handling robot (Figure 3, A, left). We used the HCS Site Generator plugin in µManager to create a stage position list containing a 5 × 5 grid of points for eight representative colonies (Figure 3, A, right). The acquisition parameters were:
- Integration time: 5 s
- Number of averages: Four
- Time points: One
- Position file: Pointer to the POS file generated by the HCS Site Generator
It took 68 minutes to automatically collect 200 spectra from the eight colonies (Figure 3, B). We used RamanSpy [11] to process the resulting spectra (Figure 3, C) as follows:
- Subtract the dark (no-laser) control spectrum
- Crop the spectrum to the range [900, 1,900 cm−1]
- Remove cosmic rays with the Whitaker–Hayes algorithm [12]
- Smooth with the Savitzky–Golay algorithm
- Remove baseline
- Normalize to [0, 1]
To assist in identifying chemical components from noisy spectra, we applied non-negative matrix factorization (NMF) to the entire dataset. From the resulting basis spectra, one of the components (Figure 3, D) corresponds to the Raman spectrum of β-carotene [13], based on the peaks around 1,006 cm−1, 1,157 cm−1, and 1,523 cm−1. These peaks are consistent with other reports of Raman spectroscopy performed on Chlamydomonas reinhardtii [14][15][10].
Overall, this demonstration illustrates that AutoOpenRaman can be used for fully automated acquisition of Raman spectra from multiple positions in a 96-well plate.
Methods
We used ChatGPT to help write code, suggest wording ideas and then choose selected phrases, and clarify and streamline text that we wrote. We used Claude to help write code, clean up code, and add comments to our code.
We used arcadia-pycolor (v0.6.4) [16] to generate figures before manual adjustment.
Key takeaways
AutoOpenRaman is a hardware and software solution for automated Raman spectroscopy. We designed it for scientists who need to collect Raman spectra from different samples or time points at high throughput and with minimal human intervention. To enable complex experiments, users can integrate devices supported by µManager into AutoOpenRaman — here, we added a shutter for time-lapse experiments and a neon light source for quick calibration. While adding devices to AutoOpenRaman requires programming experience, installing and using the software without alteration is straightforward. Overall, AutoOpenRaman is a flexible, extendable resource for automating Raman spectroscopy.
Next steps
We currently don’t plan to continue development on AutoOpenRaman for two reasons:
- Our samples tend to have high autofluorescence in the visible spectrum, so for future work, we plan to use an infrared laser instead of the green one used in OpenRAMAN.
- Biomolecules like proteins, nucleic acids, lipids, and carbohydrates tend to have poor Raman cross-sections compared to inorganic molecules like metals, minerals, and salts. Therefore, we plan to use a more powerful, variable-intensity laser to obtain higher-quality spectra.
At the same time, the OpenRAMAN spectrometer worked very well for studying non-biological materials. We encourage others to use and develop additional functionality for AutoOpenRaman. The following features could be helpful:
- Add a command-line interface to simplify high-throughput experiments
- Add two-camera support to enable control of both the spectrometer camera and a microscope camera simultaneously
- Implement “smart” spectroscopy where users can adjust acquisition parameters in a closed-loop fashion with machine learning.
We'd also like to get your feedback! What features would make AutoOpenRaman more useful to you or colleagues in your field? Are there alternative hardware and software solutions that we haven't considered?
References
Share your thoughts!
Feel free to provide feedback by commenting in the box at the bottom of this page or by posting about this work on social media. Please make all feedback public so other readers can benefit from the discussion.
