 Published on Sep 22, 2025 by Arcadia Science
 How do we balance labor and yield in high-throughput protein expression?
Contributors (A-Z)
How do we balance labor and yield in high-throughput protein expression?
Purpose
We want to design enzymes with improved biophysical features, like increased activity or stability. Our general approach is to design candidate enzymes with protein language models and assess them with downstream quality control, enzymatic activity, and protein stability assays. This involves generating ~100 recombinant protein variants at a time to screen in vitro. To generate this many proteins in parallel, we need high-throughput, automatable protein expression and purification workflows that are extensible to various proteins of interest and variants thereof. Performing protein purification in a 96-well plate format is fairly straightforward and thus amenable to scaling throughput. However, protein expression is more challenging to perform without significant labor costs.
In this pub, we describe some exploratory tests measuring culture growth and protein production in a variety of growth formats. We designed an angled tube rack to increase aeration and enhance cell growth in 16 mm tubes, which increased protein yield slightly above growing cultures in upright tubes, but not enough for our purposes. We’re left with small flasks as our only realistic option for growing cultures, and these are both clunky to handle and not amenable to automation.
This is where we ask for input: how do we express protein in high throughput while also generating enough material for downstream applications and testing? We’re hoping to spark discussion and would love for anyone with experience in high-throughput protein expression or automation to comment on this pub with ideas!
- 3D-printing designs and instructions for our angled 16 mm tube rack are available on Printables and NIH 3D.
Share your thoughts!
Feel free to provide feedback by commenting in the box at the bottom of this page or by posting about this work on social media. Please make all feedback public so other readers can benefit from the discussion.
Our approach so far
In the following subsections, we describe our first attempts to devise culture growth strategies that maximize protein expression and the overall throughput of our process, which we’d ultimately like to automate. Our initial approach focuses on expressing variants of the human enzyme adenosine deaminase 1 (ADA1). The data we describe here includes results using both wild-type ADA1 and a subset of designed variants, but we hope that any solutions we find will be broadly applicable to optimize the expression of other proteins we may want to work with.
If you read on, you’ll see that we found some ways to improve expression, but no silver bullet. We’re curious whether readers have ideas for what we should try next. To see the questions we have for you, jump to “So where does that leave us?” Consider leaving a comment or responding to our poll!
Required protein yields
We express our proteins in Escherichia coli using an IPTG-inducible system. We’ve already optimized the induction conditions for our current set of test variants and now keep them consistent across runs. For full methodological detail, skip to “Methods.” The main question is which growth vessel and volume of culture will produce enough protein for our purposes. We aim to produce 100 µg of protein per variant. This quantity allows for quantification (Bradford), quality assessment (SDS-PAGE gel), activity assays, and stability measurements. A detailed breakdown is shown in Table 1. While this is our specific protein yield requirement for ADA1, we expect 100–200 µg to be sufficient for thorough downstream testing of any protein of interest.
Assay | Purpose | Replicates | Total protein needed |
Bradford | Protein quantification | One | 2 µg |
SDS-PAGE gel | Sample quality | One | 5 µg |
Spectrophotometric substrate conversion | Protein activity | Three | 27.3 µg |
Thermal stability assay | Protein stability | Three | 50.4 µg |
Total | 84.7 µg |
Amounts of protein required for various steps of our testing pipeline.
Exploratory tests suggest aeration is key to higher yield
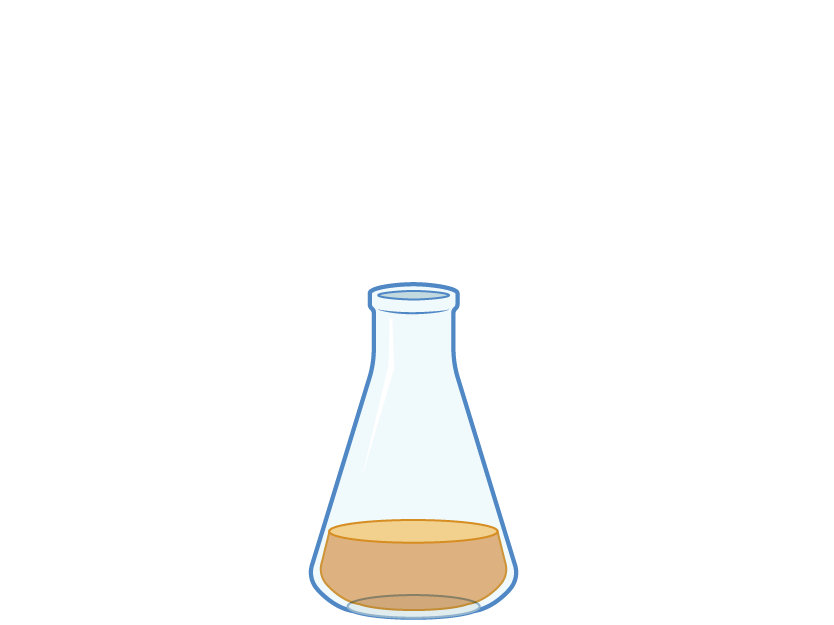
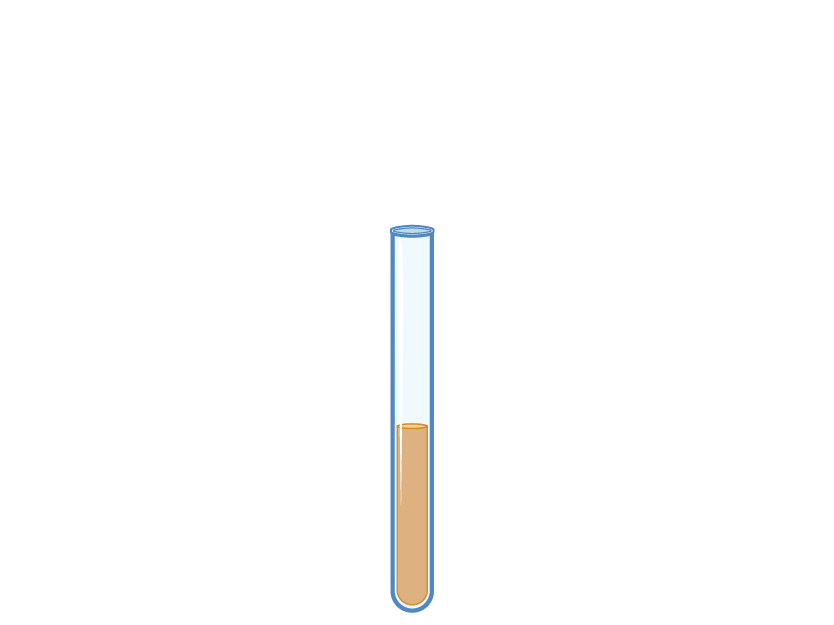
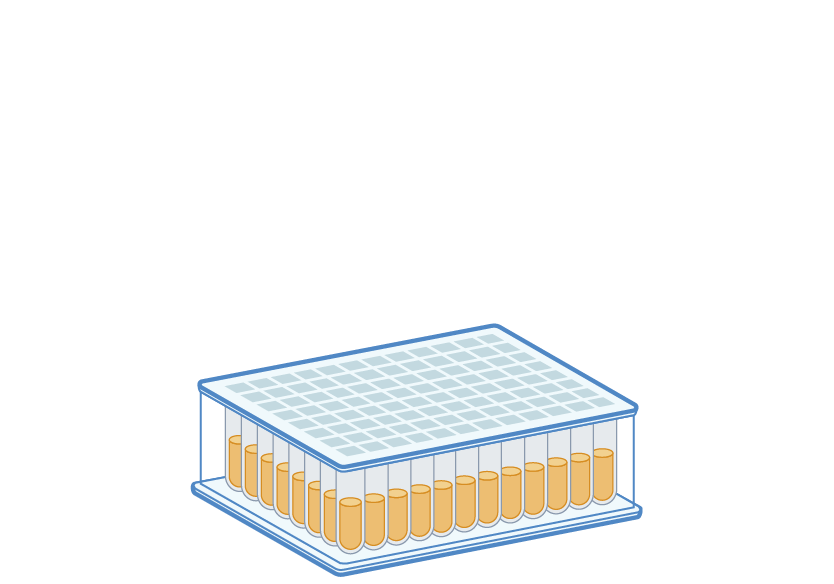
Without performing any optimization, we did some exploratory work to compare protein yields across different growth methods. Table 2 lists the different growth methods and corresponding average protein yields across all variants we tested in our first pass. Figure 2 depicts these growth formats and all those we ultimately tried. Note that the purification methods for all three growth conditions differ slightly (see “Methods”), potentially confounding these data. This is because we were initially focused on optimizing purification, downstream assays, and pilot testing rather than expression, and only went back and reanalyzed these data with yield in mind.
Growth vessel | Vessel brand and catalog # | Total expression volume | Average purified protein yield per mL starting culture | Average total yield | # of variants purified | Notes |
 250 mL flask | VWR 10536-914 | 100 mL | 25.6 µg | 2,560 µg | 21 | |
 16 mm culture tube, upright | Avantor 47729-580 | 10 mL | 4.9 µg | 49 µg | 21 | |
1.5 µg | 15 µg | 1 | We purified one of the low-yield variants aggregated in the row above in four replicates | |||
 2 mL deep-well plate | Thermo Scientific 278743 | 1 mL | 5.8 µg | 5.8 µg | 1 | We purified the low-yield variant mentioned above in six replicates |
Protein yield across growth conditions.
Since we compiled this data from various experiments, not all variants we purified in different batches were the same, and we didn’t follow the exact same purification protocol every time, so it's hard to directly compare these values. We did purify 21 of our test variants in both 100 mL and 10 mL batches under the same prep conditions, and we report those values here. Similarly, we tried purifying one of those variants from 10 mL of culture (in four replicates) and also purified it from 1 mL of culture (in six replicates).
The only growth condition we tested that’s truly high-throughput (and easily automated) is growing 1 mL of culture in a 2 mL deep-well plate. Unfortunately, the maximum yield for this method was only 5.8 µg. Reminder — we need over 80 µg of each variant for our downstream work. The particular variant we tested using this method is lower-yield (around 30% of the average variant’s yield), but based on our results with other variants in larger growth vessels, we don’t imagine any will come close to providing the amount of material we need. Scaling this growth up to 10 mL in culture tubes also yielded insufficient protein and required significant labor to grow and harvest. Scaling up to 100 mL volume in flasks had marginal labor requirements over the 10 mL in culture tubes, but yielded much more protein (2,560 µg average yield vs. 49 µg). Not only did the increased volume of the flasks contribute to the improved yield, but the average yield per mL of culture was also improved [25.6 µg/mL culture (flasks) vs. 4.9 µg/mL culture (tubes)]. This indicates that the cultures in flasks are more productive than the cultures in tubes.
Designing a slanted tube rack to increase aeration in smaller cultures
It isn't surprising that the cultures in flasks were more productive than the cultures in tubes and the plate. Good aeration and mixing are critical for the health and productivity of bacterial cultures, both of which are considerably better in a flask compared to an upright culture tube [1]. We thought we might be able to improve the growth in our culture tubes by adjusting one simple variable to increase aeration: the angle at which the tube is held in the incubator shaker.
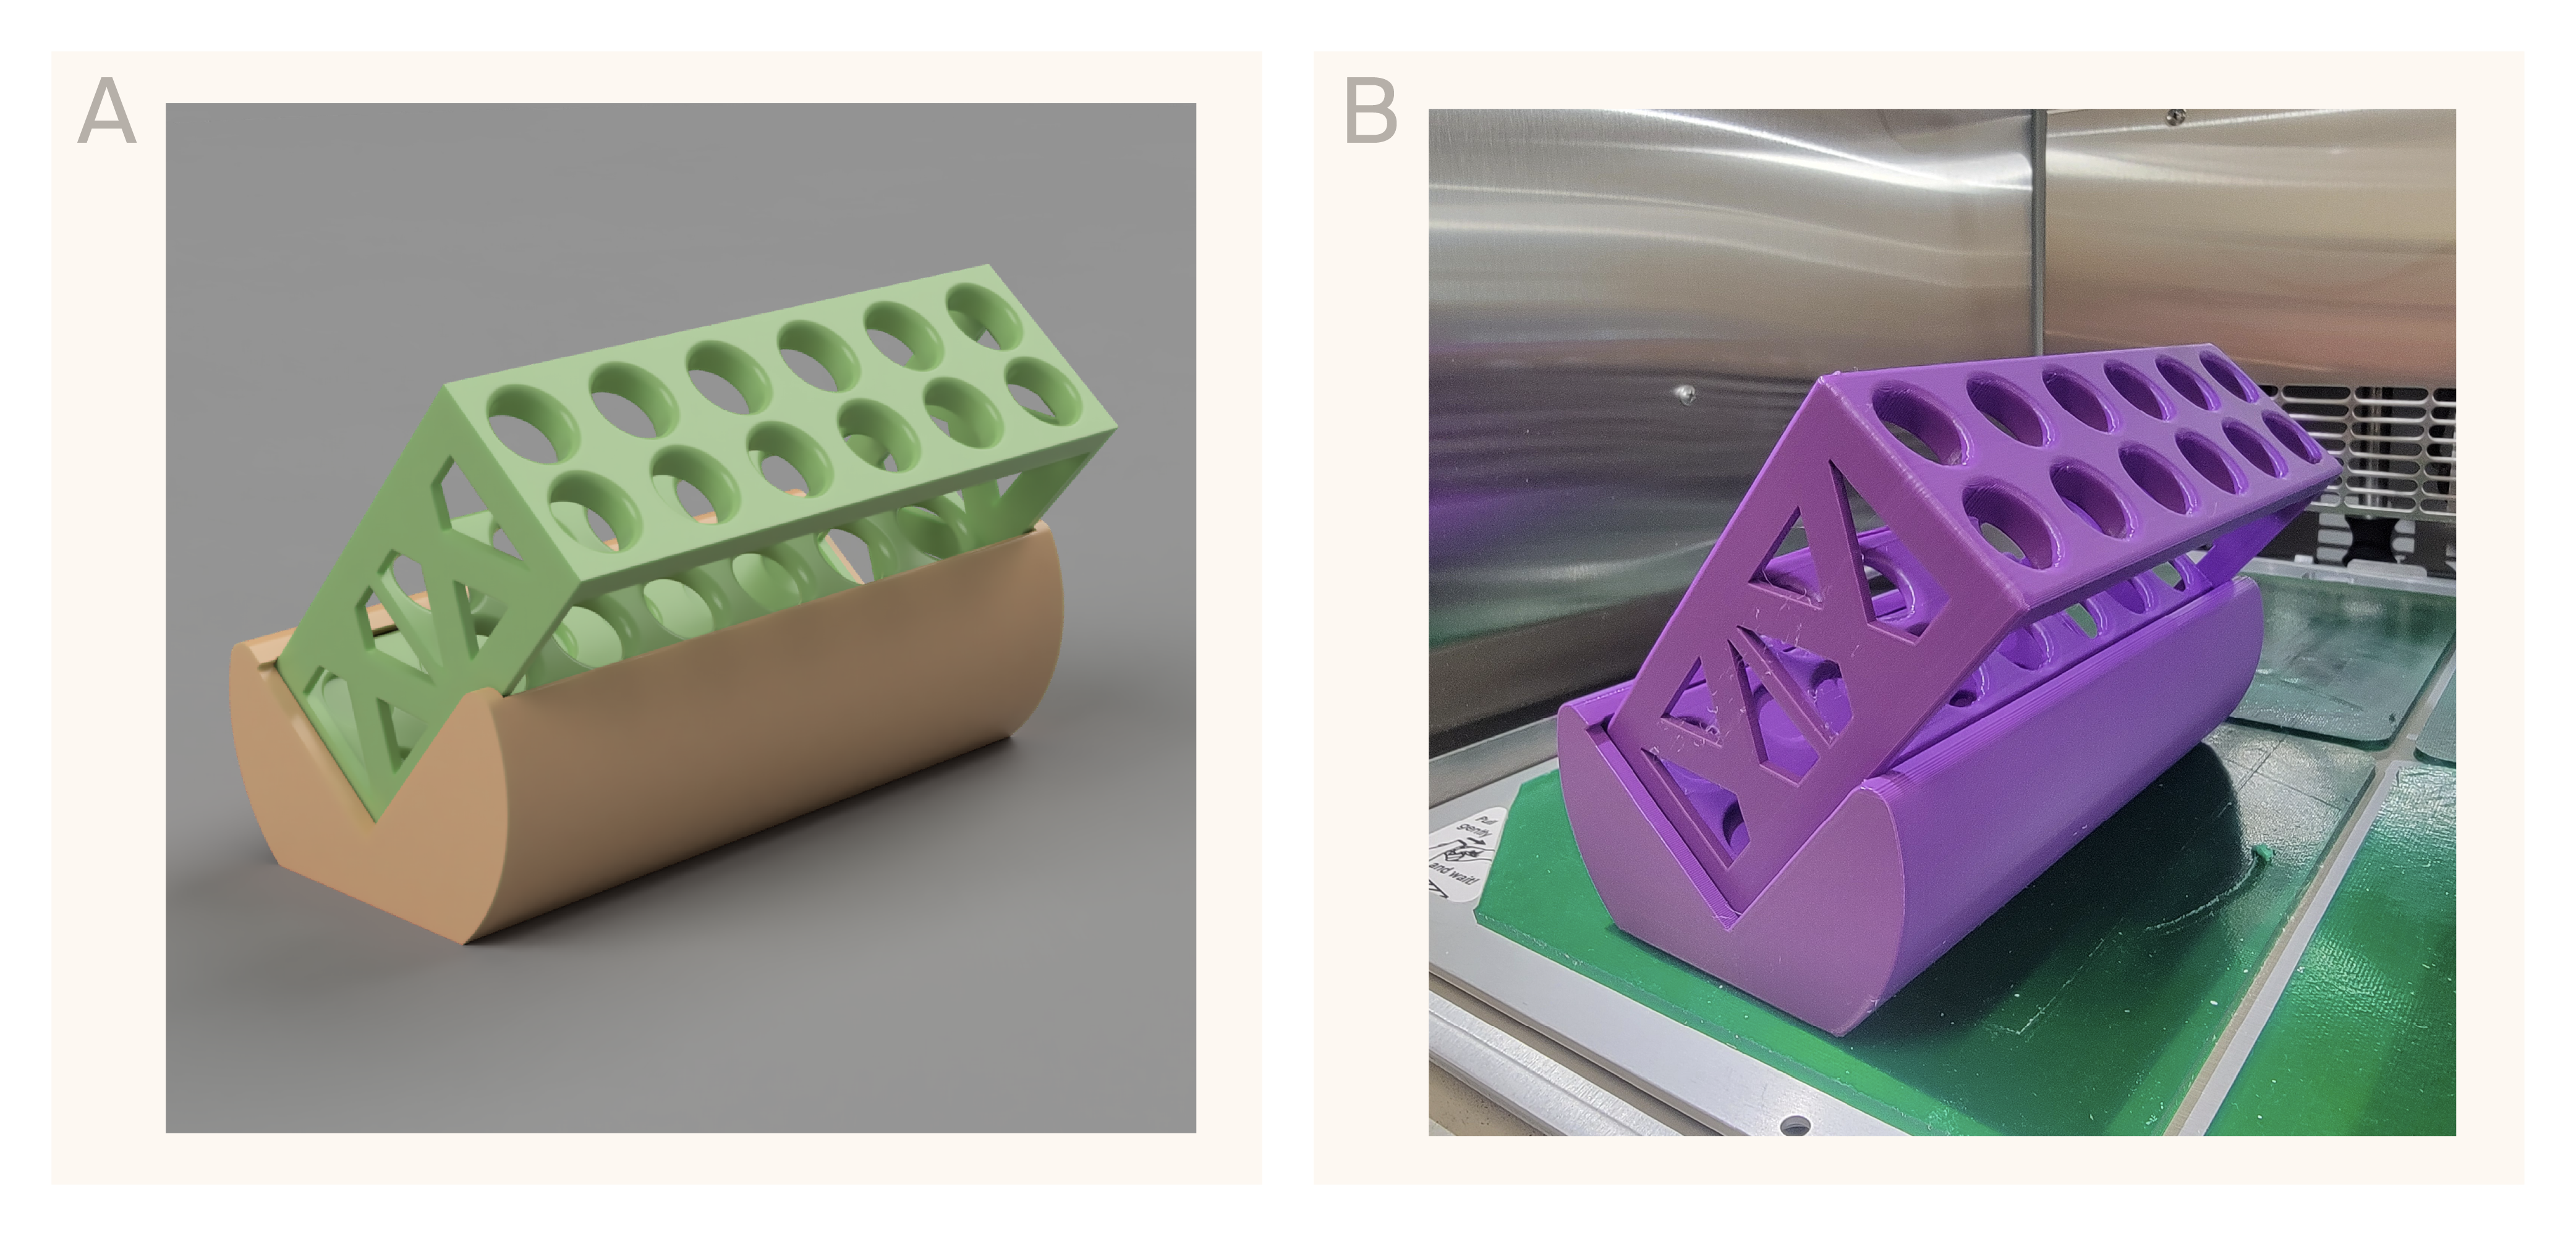
Rendering (A) and photograph (B) of our 3D-printable angled tube rack.
The design includes a two-by-six 16 mm tube rack and a separate, 40°-angled base. Access the files to print these components yourself here.
Online searches for racks that would position our tubes at an angle were difficult to find and quite costly (in the $400 range!). We decided to design our own angled tube rack holder that we could 3D-print for less than $5 in under six hours. Our goal was to design something that could fit onto a single print bed, didn't require any additional supports, and could be used as both a regular tube rack and an angled tube rack. The rack we designed can accommodate twelve 16 mm diameter or 15 mL conical tubes (Figure 1). Our hope was that growing our cultures in this rack would help bridge the gap in productivity between our flasks and tubes by increasing the exposure of the culture surface to air.
PRINT IT: You can download printing instructions for the angled tube rack on Printables or NIH 3D (3DPX: 022888).
Cultures with increased aeration grow faster and produce more protein; flasks are still best
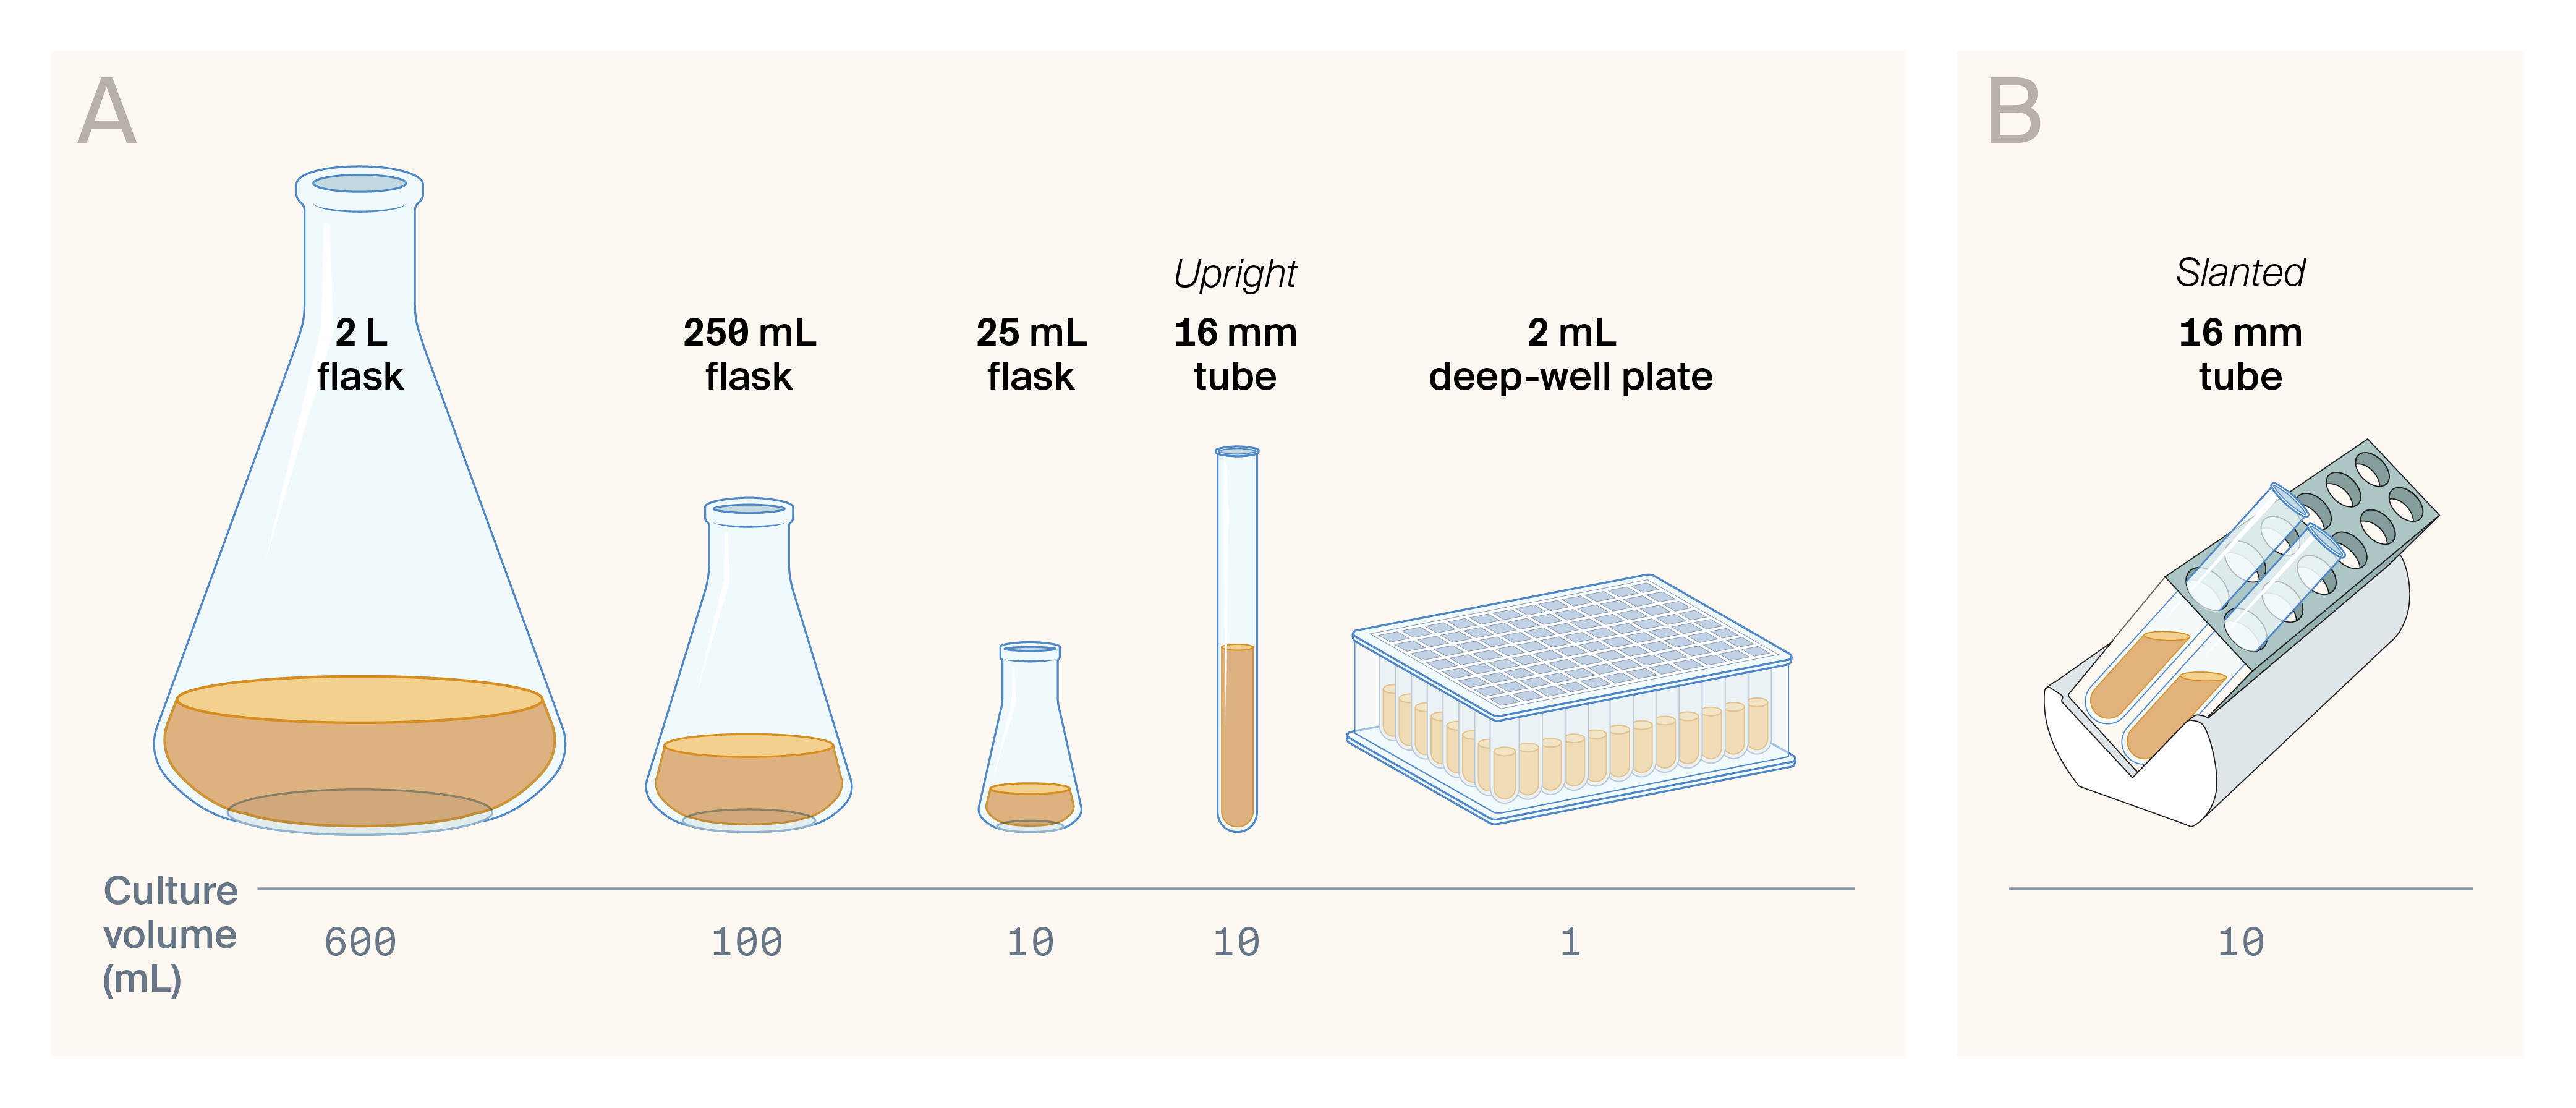
All the culture growth vessels (A) and arrangements (B) we tested in this pub.
The differences we previously observed in purified protein yield could be due to either better growth rates (leading to a denser final culture), more soluble protein per cell, or both. To differentiate the effects of these variables, we performed a study on growth rates and total soluble protein yields from some of our original growth methods and new ones, including a 2 L flask, a 25 mL flask, and our slanted tube rack tubes (Figure 2). We first tracked the growth of bacterial cultures transformed with wild-type ADA1 [pre-induction, from inoculation to an optical density (OD) of 0.6]. In every condition, we used the same starter culture and grew samples side-by-side, in triplicate.
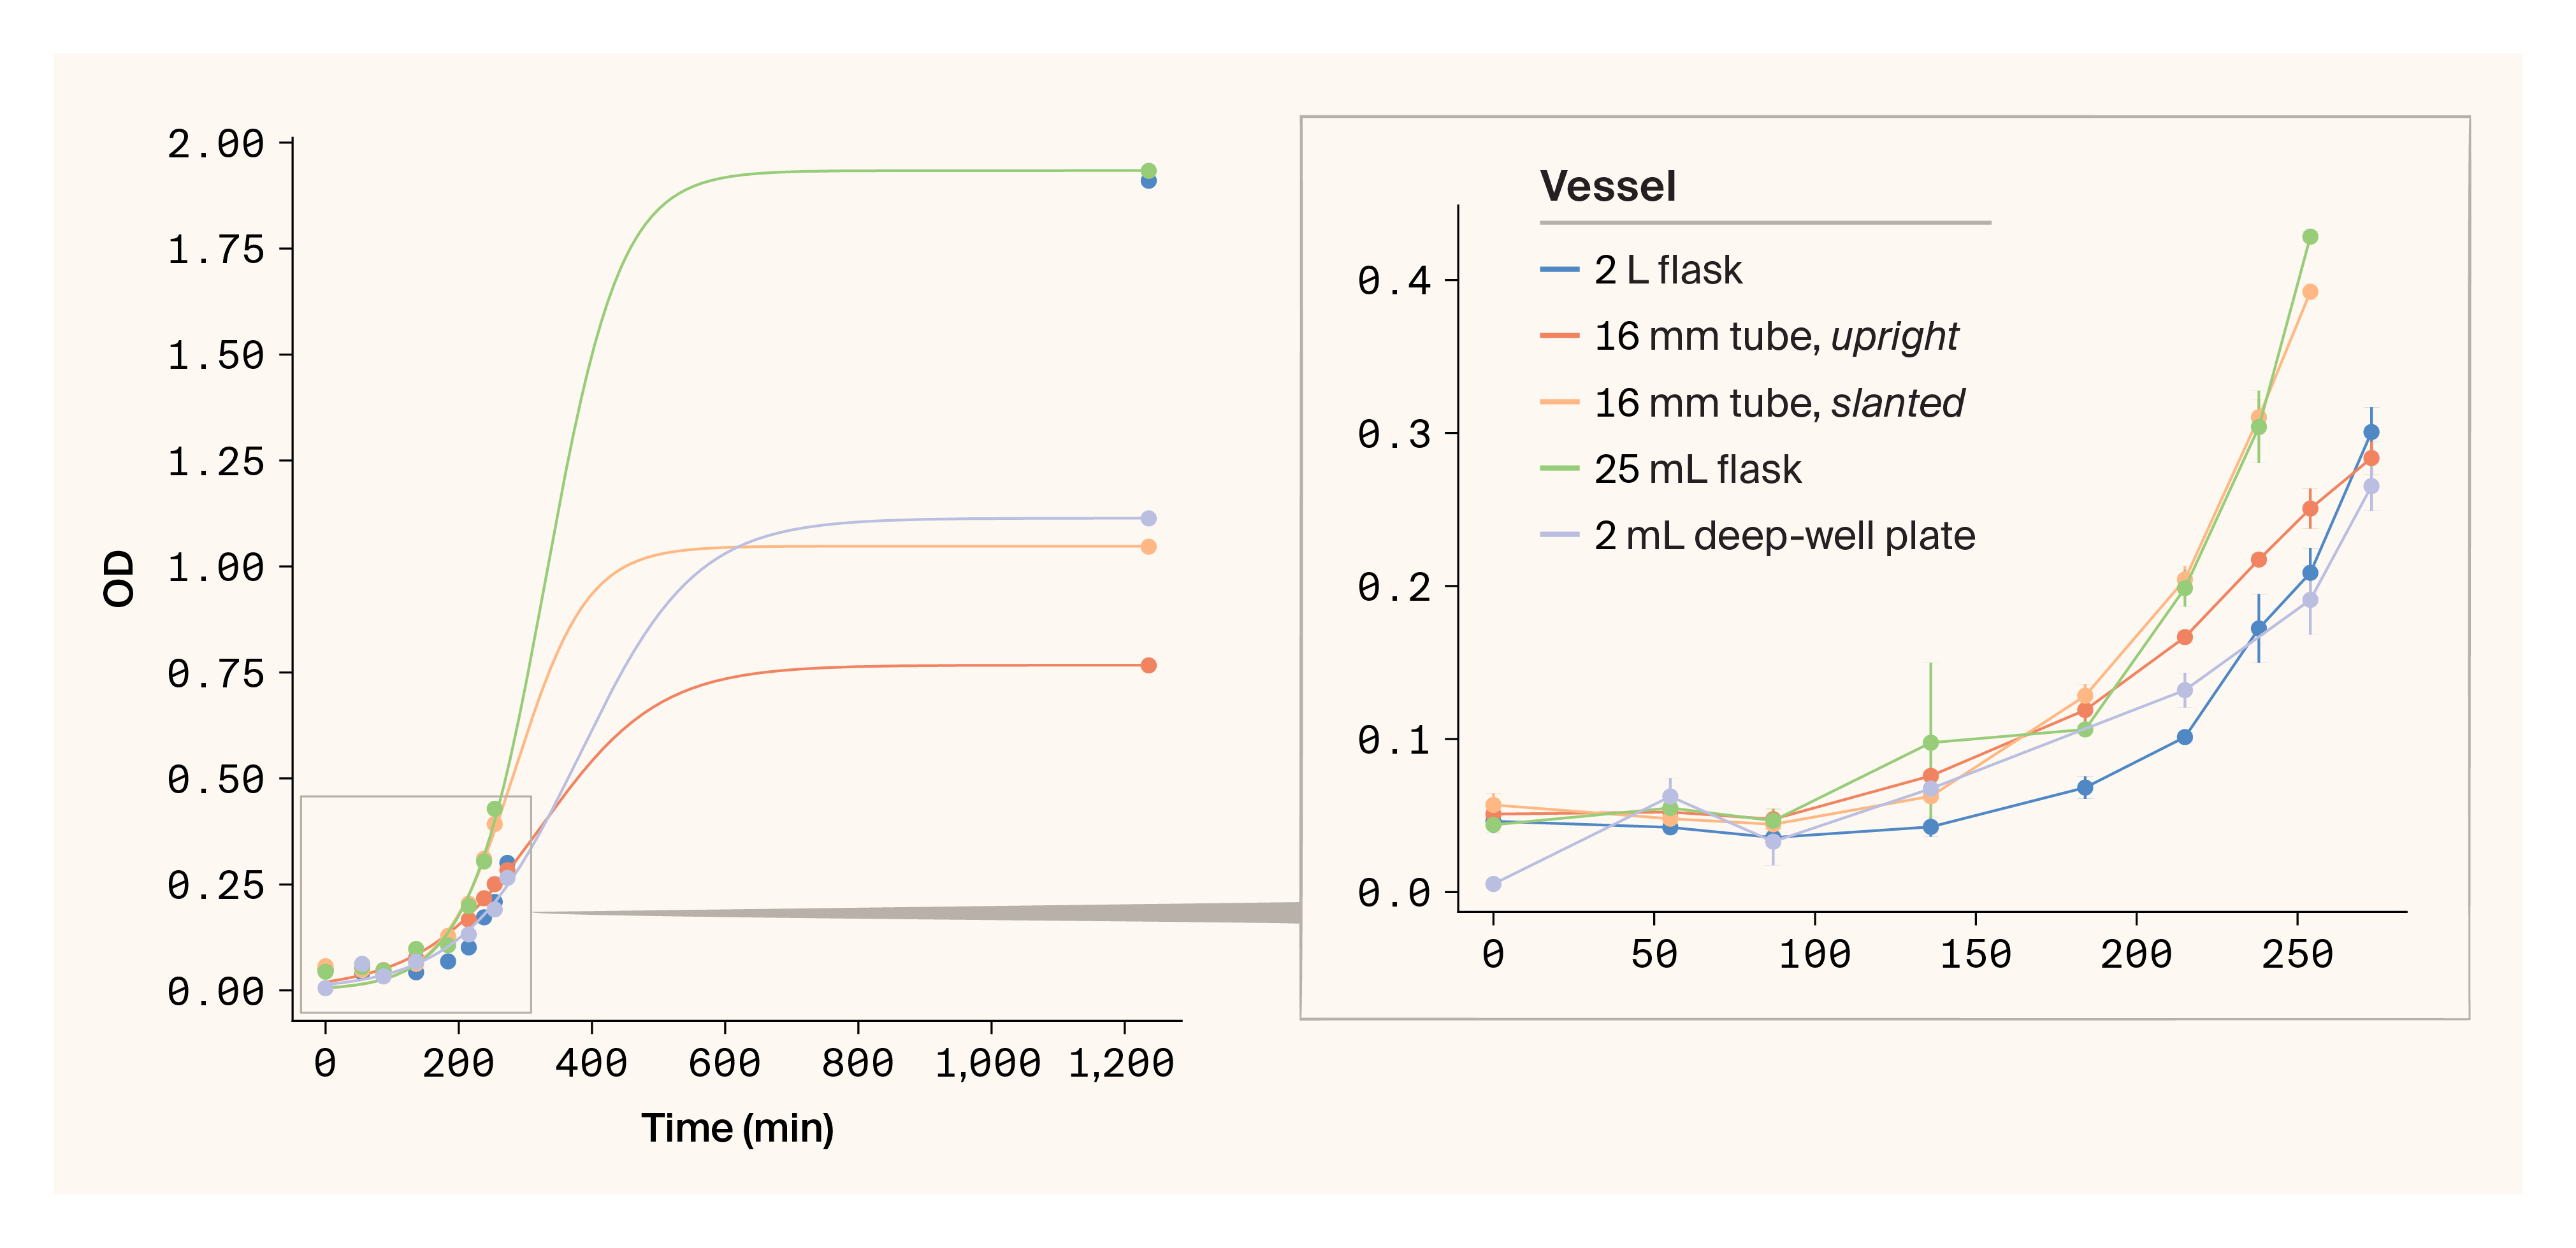
Growth curves for cultures grown in different vessels.
(A) Total, with logarithmic fit
(B) Initial linear range plus lag phase
Surprisingly, the 2 L flasks had a greater growth initiation lag and slower initial growth rate compared to the 25 mL flasks and the slanted tubes. The slanted tubes initially grew much faster than the upright tubes. The deep-well plates grew at a similar rate to the upright tubes, which isn't surprising, as they're also agitated while upright and likely have poor mixing and aeration.
We then induced these cultures and grew them overnight at 16 °C (about 18 more hours). We measured the final OD to generate full growth curves, fit them to a logarithmic function, and compared rate constants between the methods (Table 3). The rate constants for the 25 mL slanted tubes and 25 mL flasks were similar, and they were faster than the 25 mL upright tubes and deep-well plates. Measurements of the wet cell pellet mass per mL of culture aligned with the final OD readings and rate constants: the flasks outperformed the tubes, and the slanted tube rack generated slightly greater cell mass compared to the upright tubes.
We then investigated the total protein yields of each sample by examining the total soluble protein content in cell lysates. When normalized to the amount of cell pellet, the lysates from cultures grown in flasks produced more soluble protein compared to those grown in tubes (Table 3). Again, the slanted 25 mL tubes slightly outperformed the upright tubes.
Growth vessel | Vessel brand and catalog # | Total expression volume | Rate constant for culture growth | Final cell pellet mass per mL culture | Total normalized soluble protein | Estimated soluble protein yield per mL culture (not purified) |
 2 L flask | Pyrex 4980 | 600 mL | Unable to fit | 11.40 ± 2.6 mg | 3.22 ± 0.25 mg/mL | 184 µg |
 25 mL flask | Borosil 4980 | 10 mL | 0.01768 | 12.83 ± 3.0 mg | 2.99 ± 0.23 mg/mL | 192 µg |
16 mm tube, upright | Avantor 47729-580 | 10 mL | 0.01125 | 8.17 ± 0.31 mg | 2.2 ± 0.34 mg/mL | 90 µg |
 16 mm tube, slanted | Avantor 47729-580 | 10 mL | 0.01843 | 9.03 ± 0.40 mg | 2.62 ± 0.56 mg/mL | 118 µg |
2 mL deep-well plate | Thermo Scientific 278743 | 1 mL | 0.01152 | n.m. | n.m. | n.m. |
Growth rate constants and protein yield for cultures we grew and induced in various vessels.
n.m. = not measured
Taking the final cell pellet mass and normalized soluble protein levels together, we can compute an “estimated soluble protein yield” per mL of starting culture. This metric is a representation of how much protein we feed into our purification process as starting material. If we assume that each growth method has similar induction outputs for our protein of interest (anecdotally, we observe this) and that our purification yields are independent of growth method (they should be), then we can use this metric as a proxy for estimated purified protein yield. We thus estimate that the flasks produce double the amount of protein per mL of starting culture compared to upright tubes, while slanted tubes produce up to 30% more protein than the upright tubes.
Unfortunately, given that we only harvest a small fraction of the initial soluble protein during purification, we realistically need much more soluble protein in our initial lysates than what we're seeing after growth in even the slanted 16 mm tubes (Table 3). Every prep is different, and not every variant will have the same yield, so we need more robust methods to ensure that our ultimate yields are consistently sufficient across many parallel preps.
So where does that leave us?
What we know
- Our current “high-throughput” method for protein expression (2 mL deep-well plate) doesn't produce nearly enough protein for our purposes.
- The tube rack that we designed improves baseline growth and protein production in 10 mL culture tubes by up to ~30%. While it doesn't achieve the growth or induced protein levels of cultures grown in flasks, it's a definite improvement that we hope will be useful to others.
- The only method that yields enough protein for us is growth in flasks.
What we don’t know
- What other tools are out there for high-throughput protein expression? We’d especially like to find strategies that are compatible with an automated system. We’re looking for something that can accommodate a minimum of 10 mL of culture with better gas transfer than upright tubes. Is there a way to further automate parts of a larger-scale expression system process?
- Has anyone had success growing bacterial cultures in plate format with good protein yields? What other plate formats (e.g., 24-well plates) might work?
What we'll do in the meantime
- In the near term, given that we have such good yields in flasks, we’ll express proteins in ~100 mL volumes in flasks and stock up on pellets to freeze. This lets us purify whenever it’s convenient and only requires effort on the front end, instead of repeatedly (with tubes, before every purification).
- We’ve begun investigating growth in 24-well plates, which would allow us to grow cultures up to 4–6 mL but still be automatable.
We’d love to hear how readers would approach this challenge. Feel free to respond to the poll, answer any of our questions in a comment, or comment to share your thoughts more generally. We’re eager to try new strategies and will share our results when we test your ideas.
Methods
Protein expression
All protein expression began with a fresh transformation of 6×His-tagged constructs into E. coli T7 competent cells [NEB C2566H]. We picked a single colony and directly inoculated the specified volume of TB in a given test vessel, with the exception of the 2 mL deep-well plate condition, in which we inoculated the transformation recovery sample directly into the 1 mL culture at a dilution of 1:100 (no plating or single colony picked for ease of automation). We grew cultures at 37 °C, shaking at 200 rpm, until reaching an OD of ~0.4. We then transferred cultures to 16 °C, allowed them to cool down (15 min), and then induced with 0.5 mM IPTG. Cultures grew overnight at 16 °C (~16–18 h).
After growth, we harvested bacterial cultures via centrifugation at 1,500 × g for 15 min at 4 °C. We either flash-froze pellets and stored them at −80 °C or immediately used them for purification. For downstream purification, we used the whole cell pellet, with the exception of our 100 mL growth condition. In that condition, we grew a 100 mL culture, but froze four separate pellets (comprising 25 mL culture each) and purified one pellet at a time. We refer to these as the “25 mL” cultures in the purification section below.
To generate growth curves (Figure 3), we picked a single colony from a fresh transformation and inoculated it into a starter culture. Then we inoculated the different cultures in assorted growth vessels from the same starter culture at a dilution of 1:200. We performed all the remaining steps in expression the same way.
Protein purification
We performed protein purification similarly between all conditions, but did the 10 and 25 mL cultures manually and processed the deep-well plate on an automated OpenTrons Flex liquid handler. Key differences: the automated protocol begins with cell pellets in a 96-well plate, the machine performs lysis in place, and it doesn't spin the lysates before binding to beads. All other buffer components and steps described below are the same.
We resuspended cell pellets in 1 mL lysis buffer (for a 10 mL or 25 mL starting culture) or 0.45 mL for the 1 mL culture. Lysis buffer: 18 mM NaPO4, pH 7.4, 270 mM NaCl, 18 mM imidazole, 1× BugBuster (Millipore 70584-M), and protease inhibitors (Roche COEDTAF-RO). After incubating on ice for ~15 min, we centrifuged cultures for 30 min at 14,000 × g, 4 °C. We collected lysate supernatants, added them to a 96-well plate, and incubated them with Ni-NTA magnetic agarose beads (Thermo Fisher, 78605) for 30 min while rotating/mixing. We then washed beads twice with buffer A (20 mM NaPO4, pH 7.4, 300 mM NaCl, and 20 mM imidazole) and eluted protein by incubating beads for 10 min in 200 μL buffer B (20 mM NaPO4, pH 7.4, 300 mM NaCl, 500 mM imidazole, and protease inhibitors) with periodic mixing.
Determination of rate constant for culture growth
We monitored the OD of cultures at periodic intervals and plotted it against time. We collected the data in triplicate and fitted it to a logarithmic curve to generate rate constants.
Determination of wet cell pellet mass
After culture growth, we collected the same volume of culture from each condition and centrifuged at 3,000 × g for 15 min. We fully removed the supernatant without disturbing the cell pellet, recorded the pellet mass, and normalized to the starting volume.
Determination of total normalized soluble protein content
We resuspended cell pellets in 5 μL lysis buffer per 1 mg wet cell pellet and allowed them to incubate for 30 min to lyse. We then centrifuged cell lysates for 30 min at 15,000 × g to pellet cell debris. We collected cell supernatants and measured protein concentration using the Pierce BCA kit (Thermo Fisher 23225).
Determination of estimated soluble protein content per mL of culture
We used the following equation to compute this metric: (mg protein/mL lysate) × (1 mL lysate/200 mg cell pellet) × (mg cell pellet/mL culture).
Pub preparation
We used arcadia-pycolor (v0.6.4) [2] to generate figures before manual adjustment.
References
Share your thoughts!
Feel free to provide feedback by commenting in the box at the bottom of this page or by posting about this work on social media. Please make all feedback public so other readers can benefit from the discussion.
